Measuring Event ROI: The Cost Lines, the Value Lines, and What Makes the Math Honest
Written by
Sridhar Ranganathan
Last Updated :
July 31, 2026
Skim in:
12
mins
TL;DR
Event ROI feels dishonest because most teams report activity (badges scanned) instead of outcomes (meetings booked and attributable pipeline the board can trust).
Event ROI = (pipeline-sourced value minus total event cost) divided by total event cost, times 100; the formula is easy, but the inputs decide the honesty.
An honest cost line includes drayage, build-out, freight, travel, rep labor, and lead-retrieval rental, landing fully-loaded cost-per-head near 300 to 450 dollars.
The value line is qualified meetings, sourced pipeline, and influenced pipeline, not raw scans; five real conversations beat 500 unqualified badges.
Leads-to-Meeting (LTM) is the honest conversion metric: about 52 percent when booked on the floor versus roughly 8 percent for post-event chases.
Reverse-solve backward from booth cost to required pipeline, meetings, and qualified scans, turning ROI into a daily floor quota set before load-in.
Q1. Why does event ROI math feel like a lie to the board? [toc=1. The Honest-Math Problem]
Event ROI math feels dishonest because most exhibitors report activity (badges scanned) instead of outcomes (meetings booked, pipeline influenced). A $35,000 to $40,000 spend collapses into a contact list, and the board sees a story, not a number. The math only turns honest when the full cost line is counted and the value line is tied to qualified meetings and attributable pipeline. This piece rebuilds both ledgers.
📦 The shoe box nobody reopens
An old operator told me the truest thing I have heard about trade shows. His buddy Jimmy collects every business card in a shoe box.
Monday morning, Jimmy pulls three cards worth chasing. The box goes on a shelf. Six months later, someone finds it, still full.
That box is where most event ROI dies. You paid for every card in it. You will report on maybe three.
💸 Why the board hears a dodge
Here is the part that stings. Your CFO does not doubt that the show was busy.
She doubts that "busy" became money. When you spent $80,000 and she asks what pipeline it generated, "we scanned 400 leads" sounds like an evasion, not an answer.
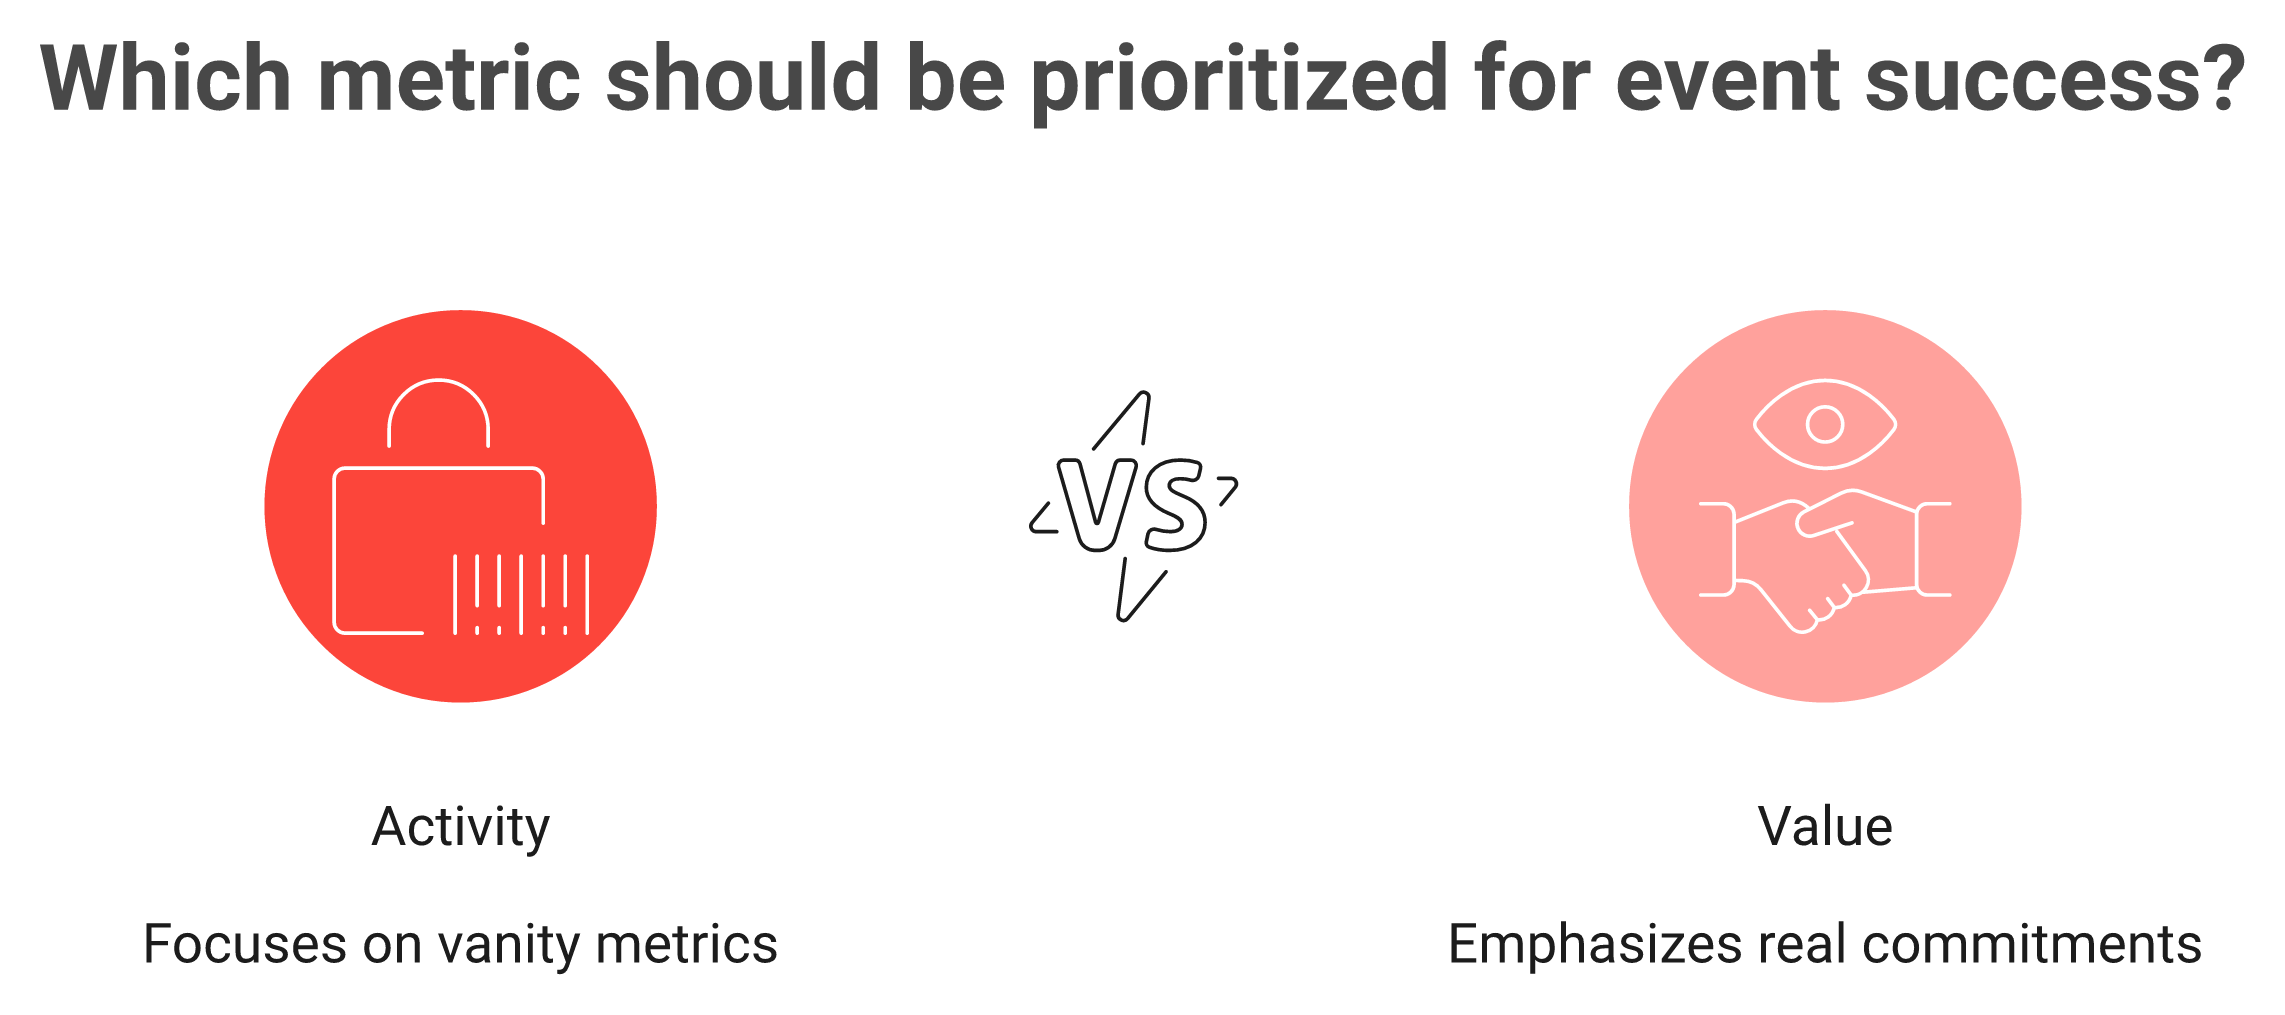
Lead counts are activity. The board buys outcomes. Report the wrong ledger and honest work still reads like spin.
✅ The two ledgers that fix it
The fix is not a fancier attribution model. It is counting both ledgers straight.
The honest cost line goes far past booth rental, stacking freight, labor, and device rental into the real all-in figure.
One ledger is every real cost, not just the booth. The other is real value: qualified meetings and pipeline you can trace, not badges you cannot. I have sat beside a Field Marketer during the Monday pipeline review when the CEO asks "where is the pipeline?", and the only thing that saves that moment is a number, not a narrative.
That is the whole promise of the offline to pipeline shift, and it is the frame behind everything B2Brain builds. You walk out of the show with meetings booked and a pipeline figure you can defend, not a CSV of 400 contacts nobody acts on. The money in a trade show is made in the follow-up, and the follow-up starts with honest math. The rest of this piece rebuilds both ledgers, line by line.
Q2. What exactly are you measuring when you measure event ROI? [toc=2. ROI Formula and Models]
Event ROI = (pipeline-sourced value minus total event cost) divided by total event cost, times 100. Three models exist: simple (revenue versus cost), incremental revenue (only the lift the event caused), and incremental margin (that lift after cost of goods). The formula is easy. The honesty lives in the inputs. Inflate the value line or understate the cost line, and every model lies.
🧮 The formula, in plain English
Return on investment (ROI) means what you got back divided by what you put in. For events, that is pipeline-sourced value minus total event cost, over total event cost, times 100.
So a show that costs $40,000 and sources $120,000 in pipeline returns 200%. Simple enough to fit on a napkin.
The trouble is never the formula. It is what you are allowed to put into it.
🔢 Three models, one $40,000 show
There are three honest ways to run the number. Each answers a slightly different question.
Simple ROI: all pipeline or revenue versus all cost. Fast, but it credits the event for deals it only touched.
Incremental revenue: count only the lift the event actually caused, not deals already in motion. Stricter, and closer to the truth.
Incremental margin: take that lift, then subtract cost of goods sold (the cost to deliver what you sold). This is the number a CFO trusts most.
On our $40,000 show, simple ROI might read 200%. Incremental margin might read 60%. Same event, very different story, depending on which model you name up front.
⚠️ Two inputs decide everything
Pick any model you like. Two inputs still make or break it.
Understate the cost line (count the booth, forget the labor) and ROI looks great. Inflate the value line (count scans as leads) and it looks even better. Both are lies of omission.
Here is my read right now, and I could be wrong on the exact split. Event spend used to sit around 25% of the marketing budget. We are seeing it crawl toward 35%, even 40%. When a line item grows that fast, finance stops accepting flattering inputs. That is exactly why the next two sections rebuild the cost line and the value line from scratch, because the model is only as honest as what you feed it. If you want to skip the manual arithmetic, our event ROI calculator runs all three models on your own numbers.
Q3. Which cost lines does every exhibitor forget? [toc=3. The Full Cost Line]
An honest cost line goes far past booth rental: drayage (the fee to move your freight on the show floor), build-out and décor, shipping, travel and hotels, rep labor and opportunity cost, giveaways, and lead-retrieval rental (about $600 per device per show). A useful sanity check is that fully-loaded cost-per-head should land around $300 to $450, travel included. Count only the booth sticker price and your ROI collapses the moment finance asks for the all-in number.
🧾 The receipts operators actually post
One founder added it up out loud. She spent over $35,000 just decorating the booth, and that was before booth rental.
Another put $36,000 into the Atlanta Market across three locations: booth, walls, and a pallet of furniture shipped in. These are not the numbers that show up in the ROI deck. They should.
Then there is labor nobody prices. One operator flew in early and set up a booth alone in seven straight hours, lights off, samples scattered. That is a full day of senior time, and it belongs on the cost line.
📋 The full cost-line checklist
If it left your bank account or your calendar because of the show, it counts. Here is the ledger most decks skip:
Space and structure: booth rental, build-out, décor, furniture, and AV.
Freight and drayage: shipping in and out, plus the floor-handling fee.
People: rep travel, hotels, per diems, and the opportunity cost of pulling reps off quota.
On-floor tools: lead-retrieval device rental, roughly $600 per device per show.
Everything else: giveaways, printing, sponsorships, and entertainment.
💰 The benchmark that keeps you honest
Here is a gut check I trust. Fully loaded, travel included, your cost-per-head should land somewhere around $300 to $450.
Run that math and the rented badge scanner starts to look expensive for what it returns. You pay about $600 per device to save a contact, and the workflow ends at a CSV. The scanner saves the lead and loses the conversation.
That is the gap we built B2Brain to close. Anything a badge scanner captures, we capture with context, then book the meeting and write the CRM record. The scanner is a cost line that returns a list. The point of counting every cost honestly is to demand a value line that is worth it, and that starts with the universal lead capture layer that sits on top of it, which is exactly where we go next.
Q4. What actually belongs on the value line? [toc=4. The Real Value Line]
The value line is not badges scanned. That is activity. Honest value is qualified meetings booked, sourced pipeline (net-new opportunities), and influenced pipeline (existing deals the event pushed forward). In long B2B cycles, closed-won lands months later, so use influenced pipeline and Projected Business Value (qualified leads times close rate times deal value) as interim signals. Five high-fit conversations beat 500 scanned strangers.
🎯 Volume is not value
Let me say the thing the category avoids. A scanned badge is worth almost nothing on its own.
"We scanned 500 leads" is a volume claim, and volume is not value. Roughly 60% of lost sales trace back to prospects who were never properly qualified in the first place. Five conversations with real buyers beat 500 strangers whose badges you happened to catch.
Scanned badges are activity, not value; qualified meetings and attributable pipeline are what the value line should count.
The value line only holds names you can defend as opportunities. Everything else is inventory in a shoe box.
🔀 Sourced, influenced, and the honest middle
Two kinds of pipeline belong on the ledger, and teams fight about both.
Sourced pipeline: net-new opportunities the event created. Deals that would not exist without the show.
Influenced pipeline: existing deals the event pushed forward, a booth conversation that unsticks a stalled account.
Some teams only count sourced and quietly undervalue the show. As one revenue leader argues, true ROI has to include the deals an event influenced, not just the ones it originated. My read is to count both, label both, and never pretend an influenced deal is net-new.
⏰ When the cycle is longer than the quarter
Here is the honest problem with B2B events. Closed-won revenue often lands two or three quarters after the show. The longest deal I have watched an operator close ran 524 days.
You cannot wait 524 days to tell the board if a show worked. So you use interim value: influenced pipeline today, plus Projected Business Value, which is qualified leads times close rate times average deal value. It is a scenario, not a guarantee, and you should label it that way.
The catch is that none of this is real if the lead has no context. A name with no "why we talked" is not a qualified meeting. That is why we start every workflow by capturing the conversation, not just the contact, on one shared layer that runs before, during, and after the show. Context is what lets a scan become a value line the CFO believes, and it is why booth teams that generate new pipeline from events treat capture as the start, not the finish. One clean conversion metric ties it all together, which is where Q5 goes.
Q5. Is there one honest metric that survives a CFO's scrutiny? [toc=5. Leads-to-Meeting (LTM)]
Leads-to-Meeting (LTM) = meetings booked divided by qualified booth leads. It is the one event metric you cannot game by scanning more badges, because low-fit scans push it down. Booking the meeting on the floor, while the buyer is present, reportedly lifts LTM to about 52% versus roughly 8% for post-event SDR chases. LTM is to events what cost-per-click is to advertising: the honest conversion number.
📐 What Leads-to-Meeting actually means
Let me define it plainly. Leads-to-Meeting (LTM) is meetings booked divided by qualified booth leads.
If 100 qualified people stop at your booth and 30 agree to a real follow-up meeting, your LTM is 30%. That is the whole formula.
It answers the only question a CFO cares about mid-cycle: how many conversations became commitments?
🎯 Why it resists gaming
Here is what I like about LTM. You cannot inflate it by scanning harder.
Scan 400 low-fit badges and your denominator balloons while meetings stay flat, so LTM drops. The metric punishes vanity volume automatically. That is rare, and it is why I trust it.
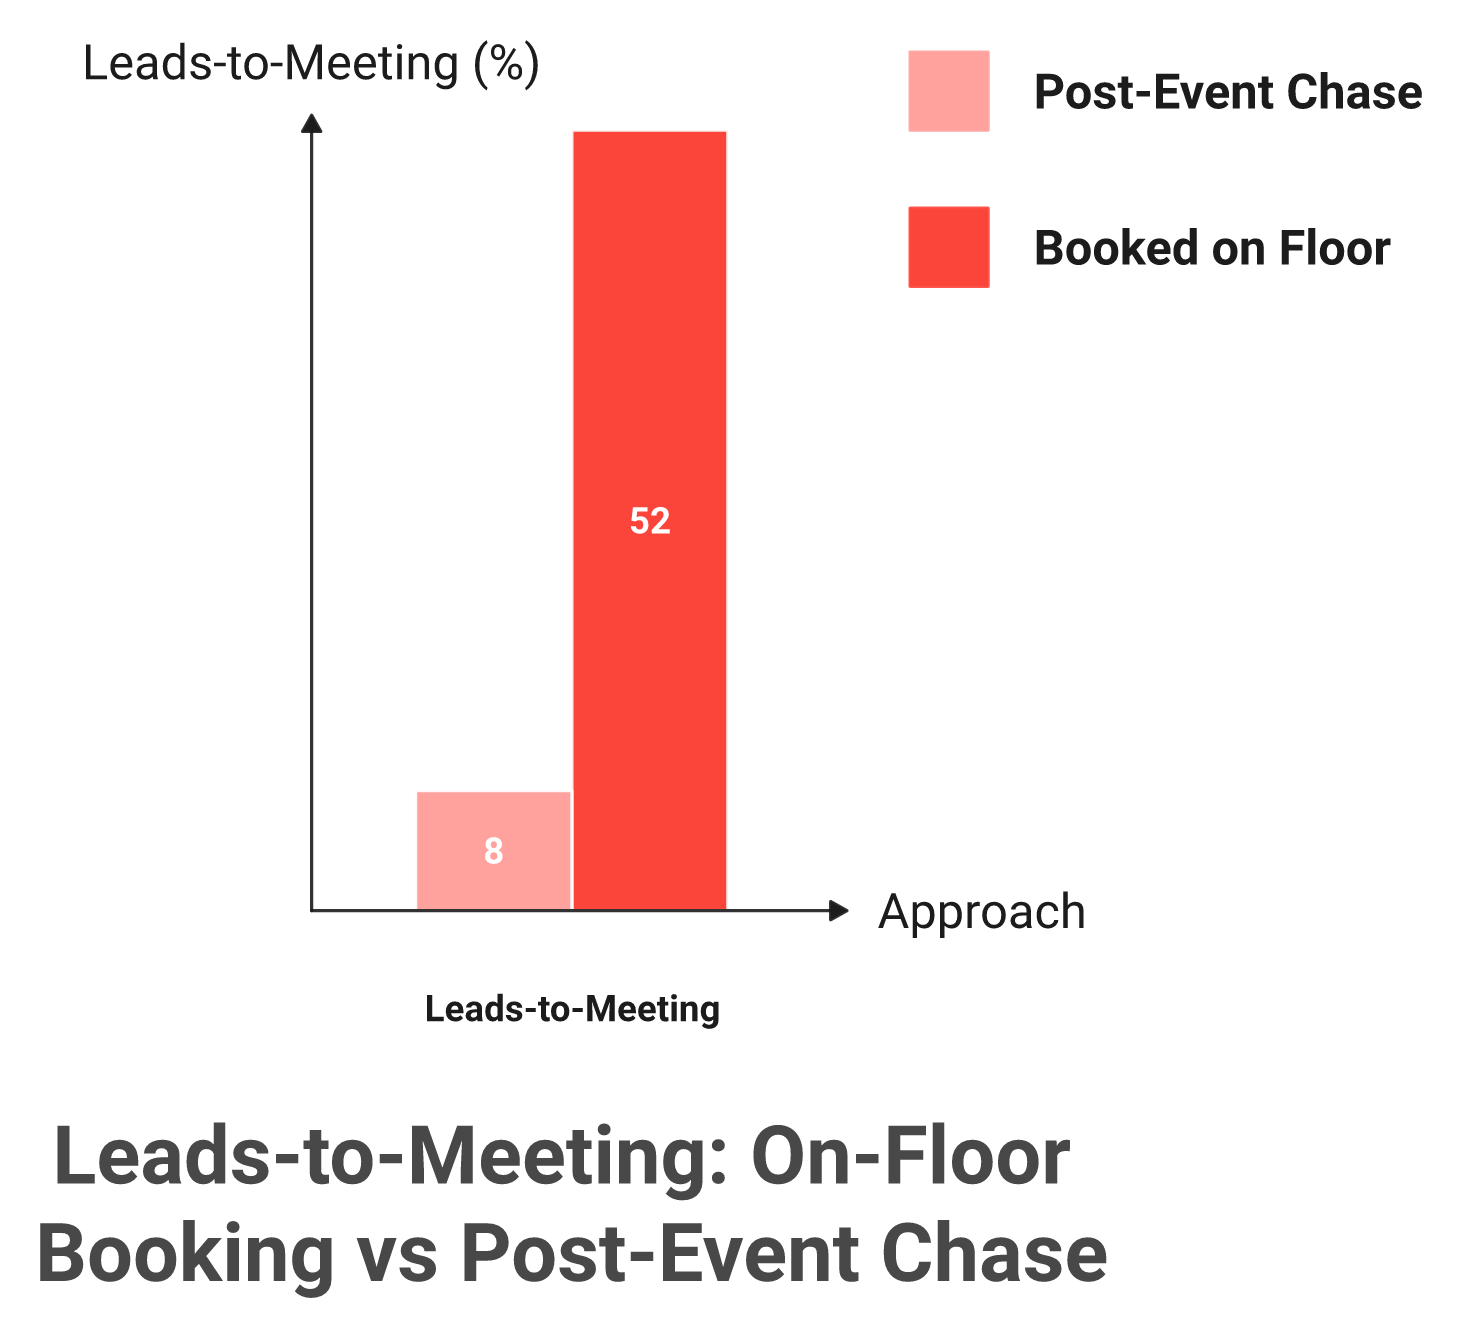
Leads-to-Meeting is the honest event conversion metric: about 52 percent booked on the floor versus roughly 8 percent chased later.
The numbers we see are stark. Booking the meeting on the floor, while the buyer is standing there, lands about 52% LTM. Chase the same list with a post-event SDR (sales development rep) sequence, and it falls to roughly 8%. It is the difference between on-floor lead capture and a cold list worked weeks later.
⏰ Why a leading metric matters at all
B2B deals are slow. The longest one I have watched an operator close ran 524 days.
You cannot wait 524 days to prove a show worked. LTM gives you an honest read on day one, long before closed-won lands.
✅ How to compute yours after the next show
Run it yourself. Take qualified booth leads as the denominator, meetings actually booked as the numerator, and divide.
Pair it with a target multiple. One revenue leader's golden rule is a 3x closed-won return per event, checked at the three-month mark. LTM tells you at the booth whether that 3x is even reachable.
I will be blunt about where this comes from. We coined and benchmark LTM at B2Brain because no badge scanner or capture tool tracks it, and "contact information is not where anything happens, pipeline is." Our whole workflow, which runs before, during, and after the show, exists to book that meeting in the moment, so the 52% is the product doing its job, not a slide. Treat LTM like the category's cost-per-click, and it becomes the honest number that survives the CFO conversation.
Q6. What makes the math dishonest, and how do you fix it? [toc=6. The Honesty Audit]
Three lies make event ROI dishonest: counting scans as leads, letting a single touch (first or last) claim all the credit, and reporting projected pipeline as guaranteed revenue. The biggest leak is follow-up: roughly 87% of leads are never properly worked, and up to 80% never reach the customer relationship management (CRM) system, while conversion decays from about 85% within two hours to about 9% after a week. Honest math discounts for all three.
📥 The situation: a CSV that arrives too late
Picture Day 3, load-out. The organizer emails you a CSV (a spreadsheet export) of scanned badges.
It has names and job titles. It has zero context on why you talked to anyone. By the time it lands, the conversations are already fading.
⚠️ The complication: three quiet lies
The math breaks in three predictable places.
Scans counted as leads: a badge is a contact, not interest. Volume masquerades as value.
Single-touch credit: first-touch or last-touch attribution hands one interaction all the credit, distorting what the event did.
Projected pipeline as fact: forecasted deals get reported as if they already closed.
Then the follow-up gap swallows the rest. Roughly 87% of captured leads are never properly followed up, and up to 80% never even reach the CRM. Conversion decays fast, from about 85% within two hours to about 9% after a week.
One operator said it plainly. Do not trust the rented badge scanner, because maybe one in twenty businesses ever act on that list, and only months later. I have watched reps at busy booths hit this wall, and the reviews say the same:
"Sometimes Mobly can be finicky, where it doesn't sync all the leads I've scanned... without those leads that I scanned but apparently didn't go through, we end up with a lot fewer than we expected." Verified User in Events Services Mobly G2 Verified Review
"I didn't really use Popl because it didn't scan bar codes like I thought it would... it didn't work when I tried it. It really didn't work for me." Drew D. Popl G2 Verified Review
✅ The resolution: capture context, book on the floor
The fix is not a smarter spreadsheet. It is three moves.
Discount projected pipeline, capture context at the moment of the conversation, and book the meeting before the buyer walks away. That is the difference between a scanner and an outcome.
This is exactly the axis we built B2Brain on. A badge scanner saves the lead and ends at the CSV. We capture the same lead with context, book the meeting, and write the CRM record in real time, so booth teams that generate new pipeline from events feed the honest math real inputs instead of a decayed list. Our full breakdown of these tools lives in the Mobly review.
Q7. Which attribution model tells the truth without drowning you? [toc=7. Choosing Attribution]
Last-touch attribution starves events of credit. Full multi-touch (W-shaped, time-decay) is honest but often over-engineered for a lean team. The pragmatic honest middle is to run every event as a CRM campaign, tag both sourced and influenced pipeline, and accept "experiential attribution," which is real but anecdotal references back to the event. The best model is the one your team actually maintains after every show.
⚠️ The problem on both ends
Attribution means deciding which touch gets credit for a deal. Pick badly and you lie in one of two directions.
Last-touch attribution gives all the credit to the final interaction, so events (which sit early or in the middle) look worthless. Full multi-touch modeling is more honest, but it can drown a three-person team. As one operator put it, you can get so caught up in attribution modeling that it is just insane.
📊 The models, side by side
Here is how the common models trade off.
Event Attribution Models Compared
Model
What it credits
Best for
First-touch
The very first interaction
Top-of-funnel demand teams
Last-touch
The final interaction before close
Simple setups (under-credits events)
W-shaped / multi-touch
First, lead-creation, and opportunity touches
Larger ops teams that can maintain it
Experiential
Anecdotal, surfaced references to the event
Lean teams who need honesty, not perfection
Multi-touch attribution spreads credit across the buyer journey, which reflects reality but demands clean data. Experiential attribution just means you surface the real reference: "this deal named the booth conversation as why they engaged."
✅ The workflow that stays honest
My read, after watching lean teams try to copy enterprise models, is that you do not need a perfect W-shaped model. You need consistency.
Do three things every show. Log the event as a CRM campaign, tag both sourced pipeline (net-new) and influenced pipeline (deals it advanced), and keep the data clean. Reps skipping data entry is where attribution quietly dies.
This is the part we automate at B2Brain. Because every booth conversation syncs to Salesforce or HubSpot in real time with event attribution attached, the sourced and influenced tagging happens as the meeting is booked, not weeks later in a manual cleanup. The morning-after report then shows attribution by show, booth area, rep, and segment, so consistency stops depending on a tired rep's memory.
Q8. How do you build the ROI target backward from booth cost? [toc=8. Reverse-Solve The Math]
Honest ROI math runs backward. Start with total booth cost, apply a 3x closed-won target to get required pipeline, divide by deal value and win rate for required meetings, then divide by your LTM for the qualified scans reps must capture. A $40,000 show targeting 3x needs $120,000 in pipeline, which sets a hard daily meeting quota before anyone walks the floor. For context, a booked event meeting can cost about 60% of an outbound meeting and about 40% of paid acquisition.
🧮 By the end of this, you will have a daily quota
Most teams compute ROI after the show, as a post-mortem. Flip it. Solve it backward, before the show, and it becomes a target reps can actually hit.
Here is the five-step reverse-solve on a $40,000 show.
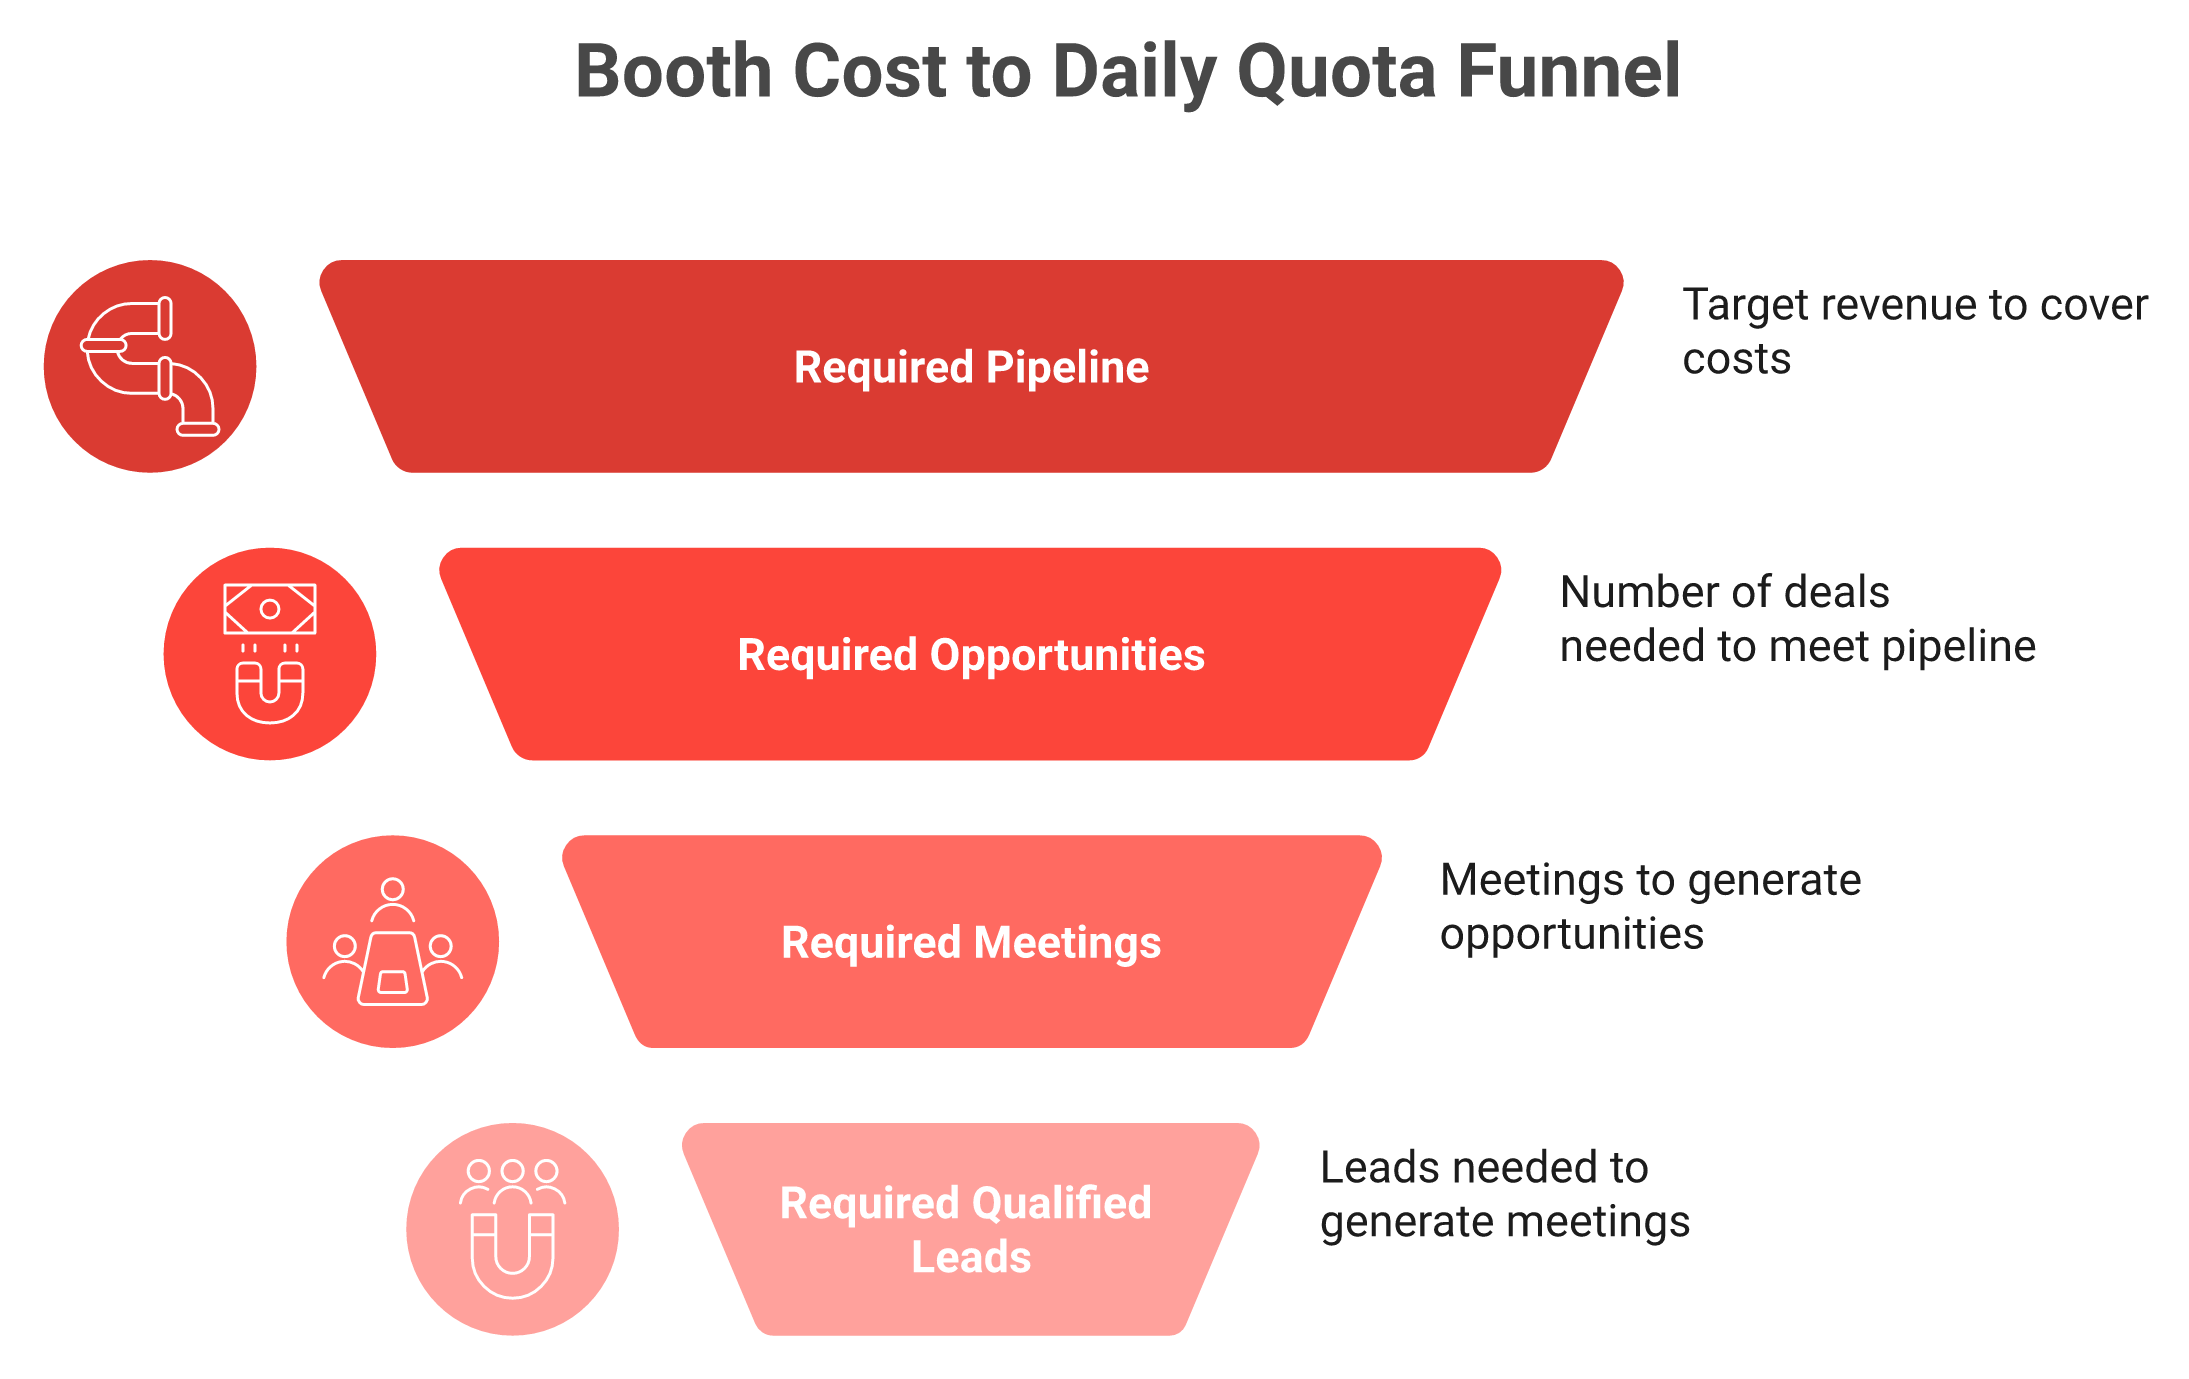
Run ROI backward: from booth cost to required pipeline, meetings, and qualified leads, ending in a daily floor quota reps can hit.
Start with total cost. All-in booth cost is $40,000.
Apply the return target. A common golden rule is 3x closed-won, so you need $120,000 in pipeline.
Convert to opportunities. At a $30,000 average deal and a 25% win rate, $120,000 in closed revenue implies roughly 16 opportunities.
Convert to meetings. If discovery-to-opportunity runs near 50%, that is about 32 qualified meetings.
Convert to captures. At a 52% Leads-to-Meeting rate, you need roughly 62 qualified booth leads across the show.
⏰ Turn it into a floor quota
Now it is operational. Sixty-two qualified leads over a three-day show is about 21 a day, or a handful per rep per hour.
That is a number a booth team can feel. It also tells you which shows deserve budget: favor events with a low exhibitor-to-attendee ratio, where senior buyers actually walk the floor.
💰 Judge it against other channels
ROI in a vacuum means nothing. Judge the event meeting against your other channels.
A qualified event meeting can cost about 60% of an outbound meeting and about 40% of paid acquisition. For context on the upside, roughly 14% of Fortune 500 firms report about $5 back for every $1 spent on trade shows. Typical show lead conversion still sits at just 5% to 10%, which is exactly why the reverse-solve matters.
This is Sridhar's own booth math, and it is why we built the event ROI calculator to run it both ways. You can forecast ROI from your assumptions, or reverse-solve from a pipeline target down to the qualified scans each rep needs per day, so the number is defensible before load-in, not guessed at load-out. If you want to see the booth-day workflow behind those numbers, that is where it lives.
Q9. How do you turn the number into pipeline you can defend? [toc=9. Floor Execution and CFO Report]
The value line is protected on the floor, then proven the morning after. Book the discovery meeting while the buyer is at the booth, send a personal verification note within 15 minutes, and work the last 40 minutes when senior buyers finally reach the hall. Then deliver a per-show report (meetings, qualified leads, sourced and influenced pipeline, and Leads-to-Meeting) the next morning, compared show-over-show, so the CFO sees exactly which events to fund again.
🎯 Protect the value line on the floor
Pipeline is not saved in the follow-up queue. It is saved at the booth, in the moment.
Do four things while the buyer is standing there.
Book the meeting on the spot. Get the 30-minute follow-up on a real calendar before they walk away. "Interested" is not a commitment.
Verify within 15 minutes. Send a short personal note fast. One operator's rule is that if you do that inside 15 minutes, you almost cannot lose the lead.
Work the last 40 minutes. At Adobe Summit, one team got its best demos in the final 40 minutes, after every other vendor had packed up. Senior buyers often reach the hall late.
Kill the invisible wall. Do not stand behind the table. And skip the raffle for a free iPad, because that only draws non-decision-makers.
⏰ Why speed beats the email sequence
Here is the contrarian bit. The "just send a post-event nurture sequence" plan mostly fails.
Reply rates on those sequences sit under 5%. The reps on the floor know the older tools fought them at exactly the wrong moment:
"It takes quite a while for the app to populate captured leads within the conference list... hoping it improves soon." Kevin M. Mobly G2 Verified Review
"It requires immediate action from the other person at the point of contact, which creates a small period of attention away from the client... not as seemless as simply giving a business card." Andrew P. Popl G2 Verified Review
📊 Prove it the morning after
Speed on the floor only counts if you can report it clean. So build the morning-after report, not the quarter-after post-mortem.
A defensible per-show report holds five things:
Meetings booked and qualified leads captured.
Sourced pipeline (net-new) and influenced pipeline (deals advanced).
Leads-to-Meeting for that specific show.
Attribution by booth area, rep, and segment.
The same numbers, compared show-over-show.
That last line changes the budget conversation. "Did this work?" becomes "which shows do we fund more of?"
This is the whole reason we built B2Brain the way we did. On the floor, reps capture context by voice in about 4.2 seconds and book the meeting on the account executive's live calendar before the prospect leaves. The next morning, the offline to pipeline report lands with the Field Marketer, so when the CEO asks "where is the pipeline?", they answer with a number, not a story. It is the payoff of the three-motion workflow that runs across the whole event. As one operator put it, the money in a trade show is made in the follow-up, and the follow-up starts before the buyer walks away. If you run booths, the booth-day workflow is built for exactly this, and you can see what B2Brain costs per event before you commit.
💬 What I am still sitting with
Here is where I think this goes next. Over the next 18 months, the fight moves up the stack, from capturing leads to activating pipeline.
I could be wrong on the timeline. But the operators who own their Leads-to-Meeting number will be the ones nobody questions at renewal, whether they capture with a trade show app or a rented badge scanner. So tell me: what are you exhibiting at next, and what pipeline number would make that show impossible to cut?
FAQ's
How do you calculate event ROI in a way a CFO will accept?
We use one formula: event ROI equals pipeline-sourced value minus total event cost, divided by total event cost, then multiplied by 100. The math is simple. The honesty lives in the inputs.
Two inputs decide everything:
The cost line: count every real cost, not just booth rental. Include drayage, build-out, freight, travel, rep labor, and lead-retrieval rental.
The value line: count qualified meetings and attributable pipeline, never raw badge scans.
A CFO stops trusting flattering numbers when event spend climbs toward 35 to 40 percent of the marketing budget. So we pair every figure with a comparison, and we discount projected pipeline instead of reporting it as guaranteed revenue.
If you want the arithmetic done for you across simple, incremental-revenue, and incremental-margin models, our event ROI calculator runs all three on your own numbers. The point is not a fancier model. The point is honest inputs that hold up in the Monday pipeline review.
What costs should be included when measuring trade show ROI?
Far more than the booth sticker price. If money left your bank account or your calendar because of the show, it belongs on the cost line.
The full ledger most decks skip:
Space and structure: booth rental, build-out, decor, furniture, and AV.
Freight and drayage: shipping in and out, plus the floor-handling fee.
People: travel, hotels, per diems, and the opportunity cost of pulling reps off quota.
On-floor tools: lead-retrieval device rental, roughly 600 dollars per device per show.
Everything else: giveaways, printing, sponsorships, and entertainment.
A useful gut check is fully-loaded cost-per-head, travel included, landing around 300 to 450 dollars. Run that math and a rented badge scanner starts to look expensive, because it saves a contact and ends at a CSV.
We count every cost honestly so we can demand a value line worth it. Anything a scanner captures, we capture with context, then book the meeting and write the CRM record.
What actually counts as value when measuring event ROI?
Not badges scanned. That is activity, and volume is not value. Honest value has three components:
Qualified meetings booked: real commitments, not "interested" contacts.
Sourced pipeline: net-new opportunities the event created.
Influenced pipeline: existing deals the show pushed forward.
Roughly 60 percent of lost sales trace back to prospects who were never properly qualified. So five conversations with real buyers beat 500 strangers whose badges you happened to catch.
B2B cycles are long, and closed-won often lands two or three quarters later. The longest deal we have watched an operator close ran 524 days. You cannot wait that long to prove a show worked, so use interim signals: influenced pipeline today, plus Projected Business Value (qualified leads times close rate times deal value), labeled as a scenario.
None of this is real without context. A name with no reason you talked is not a qualified meeting. That is why booth teams that generate new pipeline from events treat capture with context as the start, not the finish.
What is a good Leads-to-Meeting rate for events?
Leads-to-Meeting (LTM) equals meetings booked divided by qualified booth leads. It is the one metric you cannot game by scanning more badges, because low-fit scans push it down.
The benchmark we see:
About 52 percent when you book the meeting on the floor, while the buyer is present.
Roughly 8 percent when you chase the same list with a post-event sequence weeks later.
LTM is to events what cost-per-click is to advertising: the honest conversion number. It also gives you a leading read on day one, long before closed-won lands.
To compute yours, take qualified booth leads as the denominator and meetings actually booked as the numerator. Pair it with a target, like a 3x closed-won return checked at the three-month mark.
We coined and benchmark LTM because no scanner or capture tool tracks it, and the difference comes from real on-floor lead capture rather than a cold list. Own that number and the renewal conversation gets easy.
How many meetings do you need to justify the cost of a booth?
Solve it backward, before the show, so ROI becomes a target reps can actually hit. Here is the five-step reverse-solve on a 40,000 dollar show:
Start with cost: all-in booth cost is 40,000 dollars.
Apply the target: a 3x closed-won rule means you need 120,000 dollars in pipeline.
Convert to opportunities: at a 30,000 dollar deal and a 25 percent win rate, that is about 16 opportunities.
Convert to meetings: at 50 percent discovery-to-opportunity, that is about 32 qualified meetings.
Convert to captures: at a 52 percent LTM, you need roughly 62 qualified booth leads.
Sixty-two leads across three days is about 21 a day, a number a booth team can feel. For context, a booked event meeting can cost about 60 percent of an outbound meeting and 40 percent of paid acquisition.

.png)

.png)

.png)
.png)