Event ROI Calculator: How to Compute the Lead Count, Pipeline, and Payback That Justify the Booth Spend
Written by
Sridhar Ranganathan
Last Updated :
June 25, 2026
Skim in:
12
mins
TL;DR
-An event ROI calculator computes ROI percent as pipeline-sourced revenue minus total event cost, divided by total event cost; the simple formula misleads because B2B deals close three to six months later. -A defensible cost denominator includes drayage, staff time, travel, lead-retrieval rental, and follow-up labor; indirect costs run 30 to 40 percent of total spend. -The strongest calculator runs both ways: forward to ROI and payback, and backward from a target to the qualified lead count your booth actually needs. -Leads-to-Meeting (LTM) is the variable that moves ROI most; booking on the floor lifts LTM to about 52 percent versus roughly 8 percent for post-event chasing. -Payback per show plus a 3x-closed-won-at-three-months kill rule lets teams reallocate budget instead of re-booking losing events from habit. -Booth tactics like raffles, keynote-chasing, and packing up early quietly distort the inputs before any calculation runs.
Q1: What Does an Event ROI Calculator Actually Compute (and Why the Standard Formula Lies to You)? [toc=1. What It Computes]
A VP of Sales pulled me aside at a manufacturing show last fall. He had 380 badge scans on a tablet and a CEO asking one question: "So what did that booth make us?" He had no answer. He had a contact list.
That gap is the whole problem. An event ROI calculator is supposed to close it.
💰 What the calculator is actually solving for
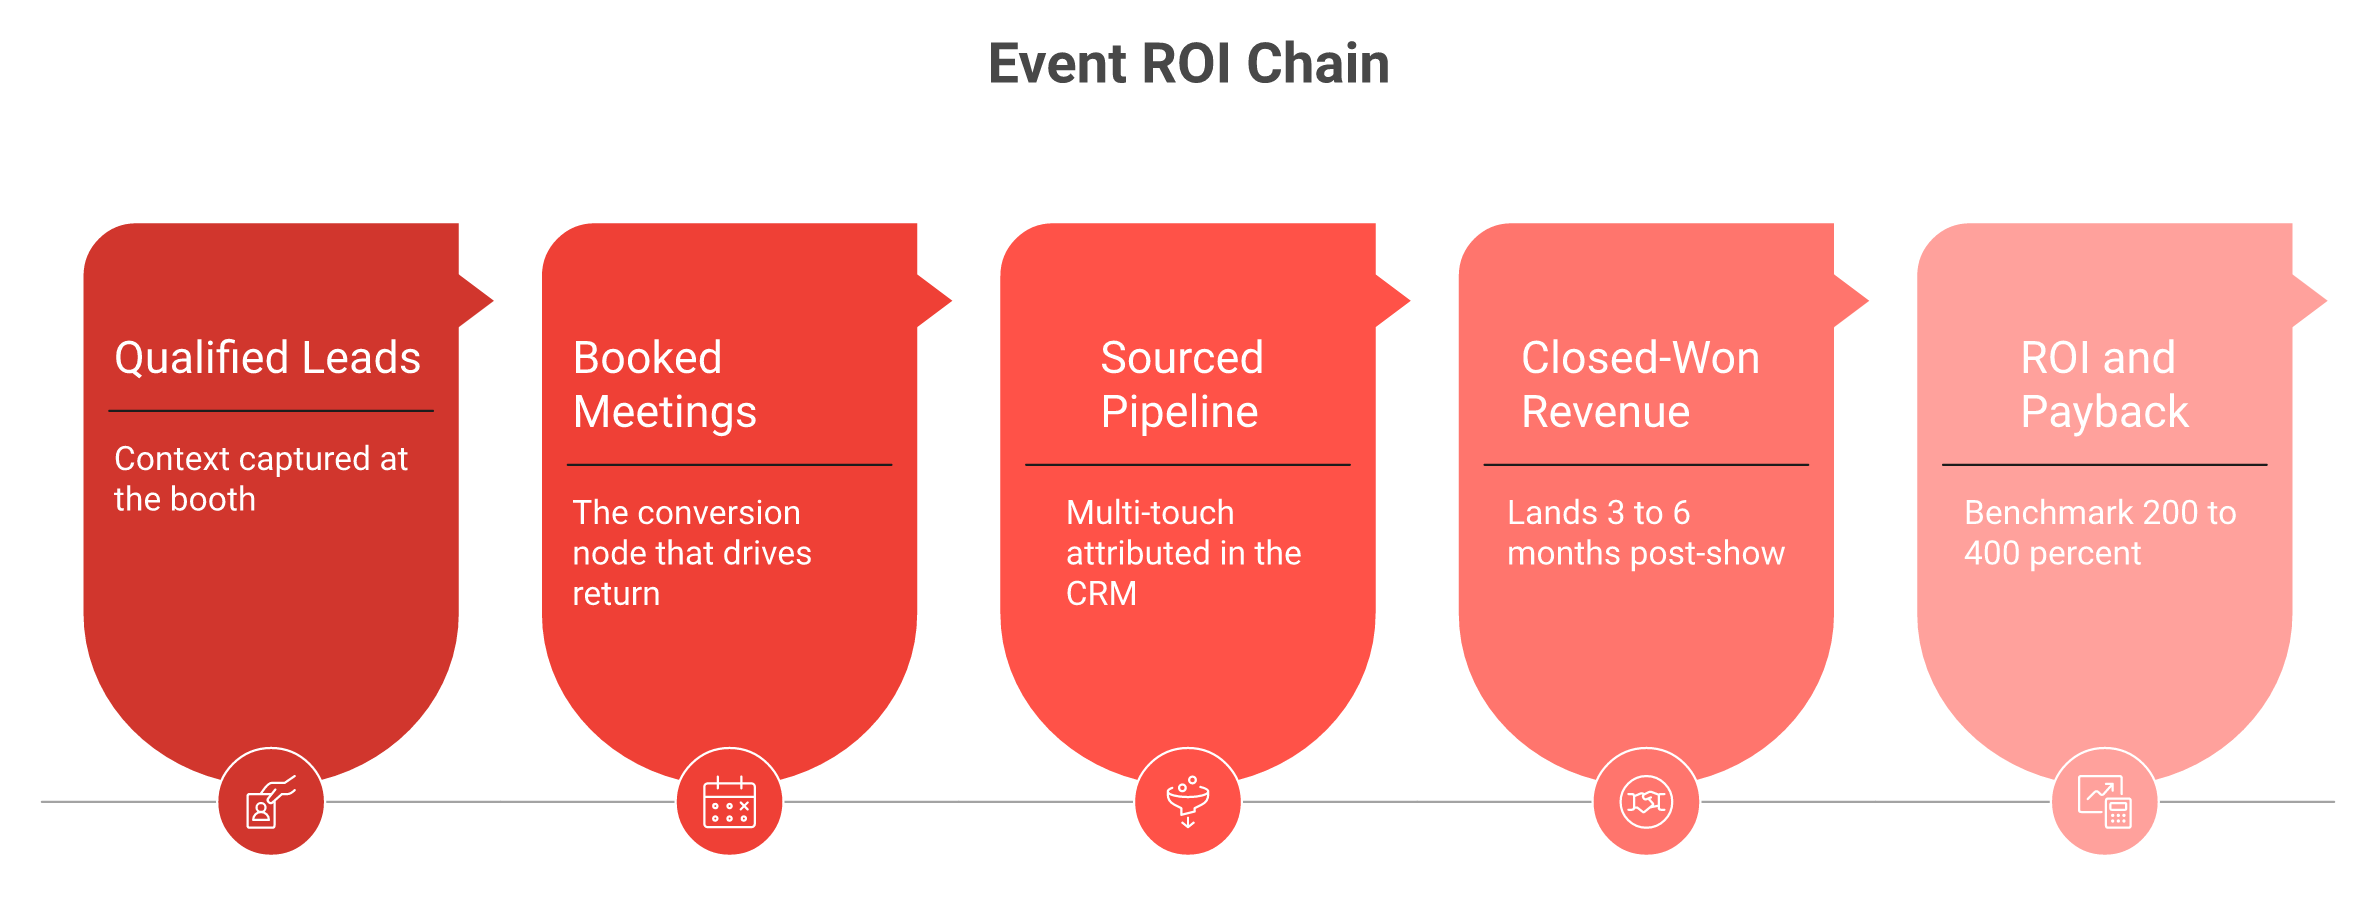
An event ROI calculator turns booth spend into a defensible return: ROI % = (Pipeline-Sourced Revenue minus Total Event Cost) divided by Total Event Cost times 100. The simple version misleads B2B exhibitors because closed-won lands three to six months later. A good benchmark is 200% to 400%, or roughly 3x closed-won pipeline. The honest model tracks the chain (qualified scans, booked meetings, pipeline, revenue) and reports payback, not just a percentage.
Here is where most calculators lie. They copy the basic accounting formula and ask for "revenue" today. But in B2B, the deal you sourced at FABTECH in March closes in September.
So the number reads zero in Q1 and the event looks like a failure. It wasn't. The revenue just hadn't arrived yet.
📊 The formula that respects a real sales cycle
The fix is to measure sourced pipeline, not just booked revenue. A defensible model frames it as Return = ((Pipeline After minus Pipeline Before) times Win Rate) minus Cost. That accounts for deals still in motion, the heart of any honest offline to pipeline calculation.
An honest event ROI calculator tracks the full chain, not a single percentage that reads zero before deals close.
Pair it with a benchmark. The "3x closed-won" rule comes straight from operators, not vendors.
"For every event I want to see three times a return on investment and closed one. You might have five, 10x in open pipeline, but I want that marker of success. At the three-month mark, if you're sitting there, that's how you know if the event was worth it."
That is the standard worth holding yourself to. Not "we got great energy."
⚠️ The four inputs that actually matter
Contact count is not one of them. As one operator put it bluntly about the organizer's scanner:
"Do not trust the badge scan, you stupid little tag. It collects leads for them. It does nothing for you."
A real calculator needs four inputs: qualified leads, booked meetings, win rate, and average deal value. That chain is what produces a number you can defend, and it is exactly what the three-motion workflow is built to feed.
This matters more every year. Event spend has climbed from "the 25% range" of marketing budgets historically to "the 35, even 40% range" for many teams. When you are spending 40% of the budget, "I think it went well" is not a sentence you can say to a CFO.
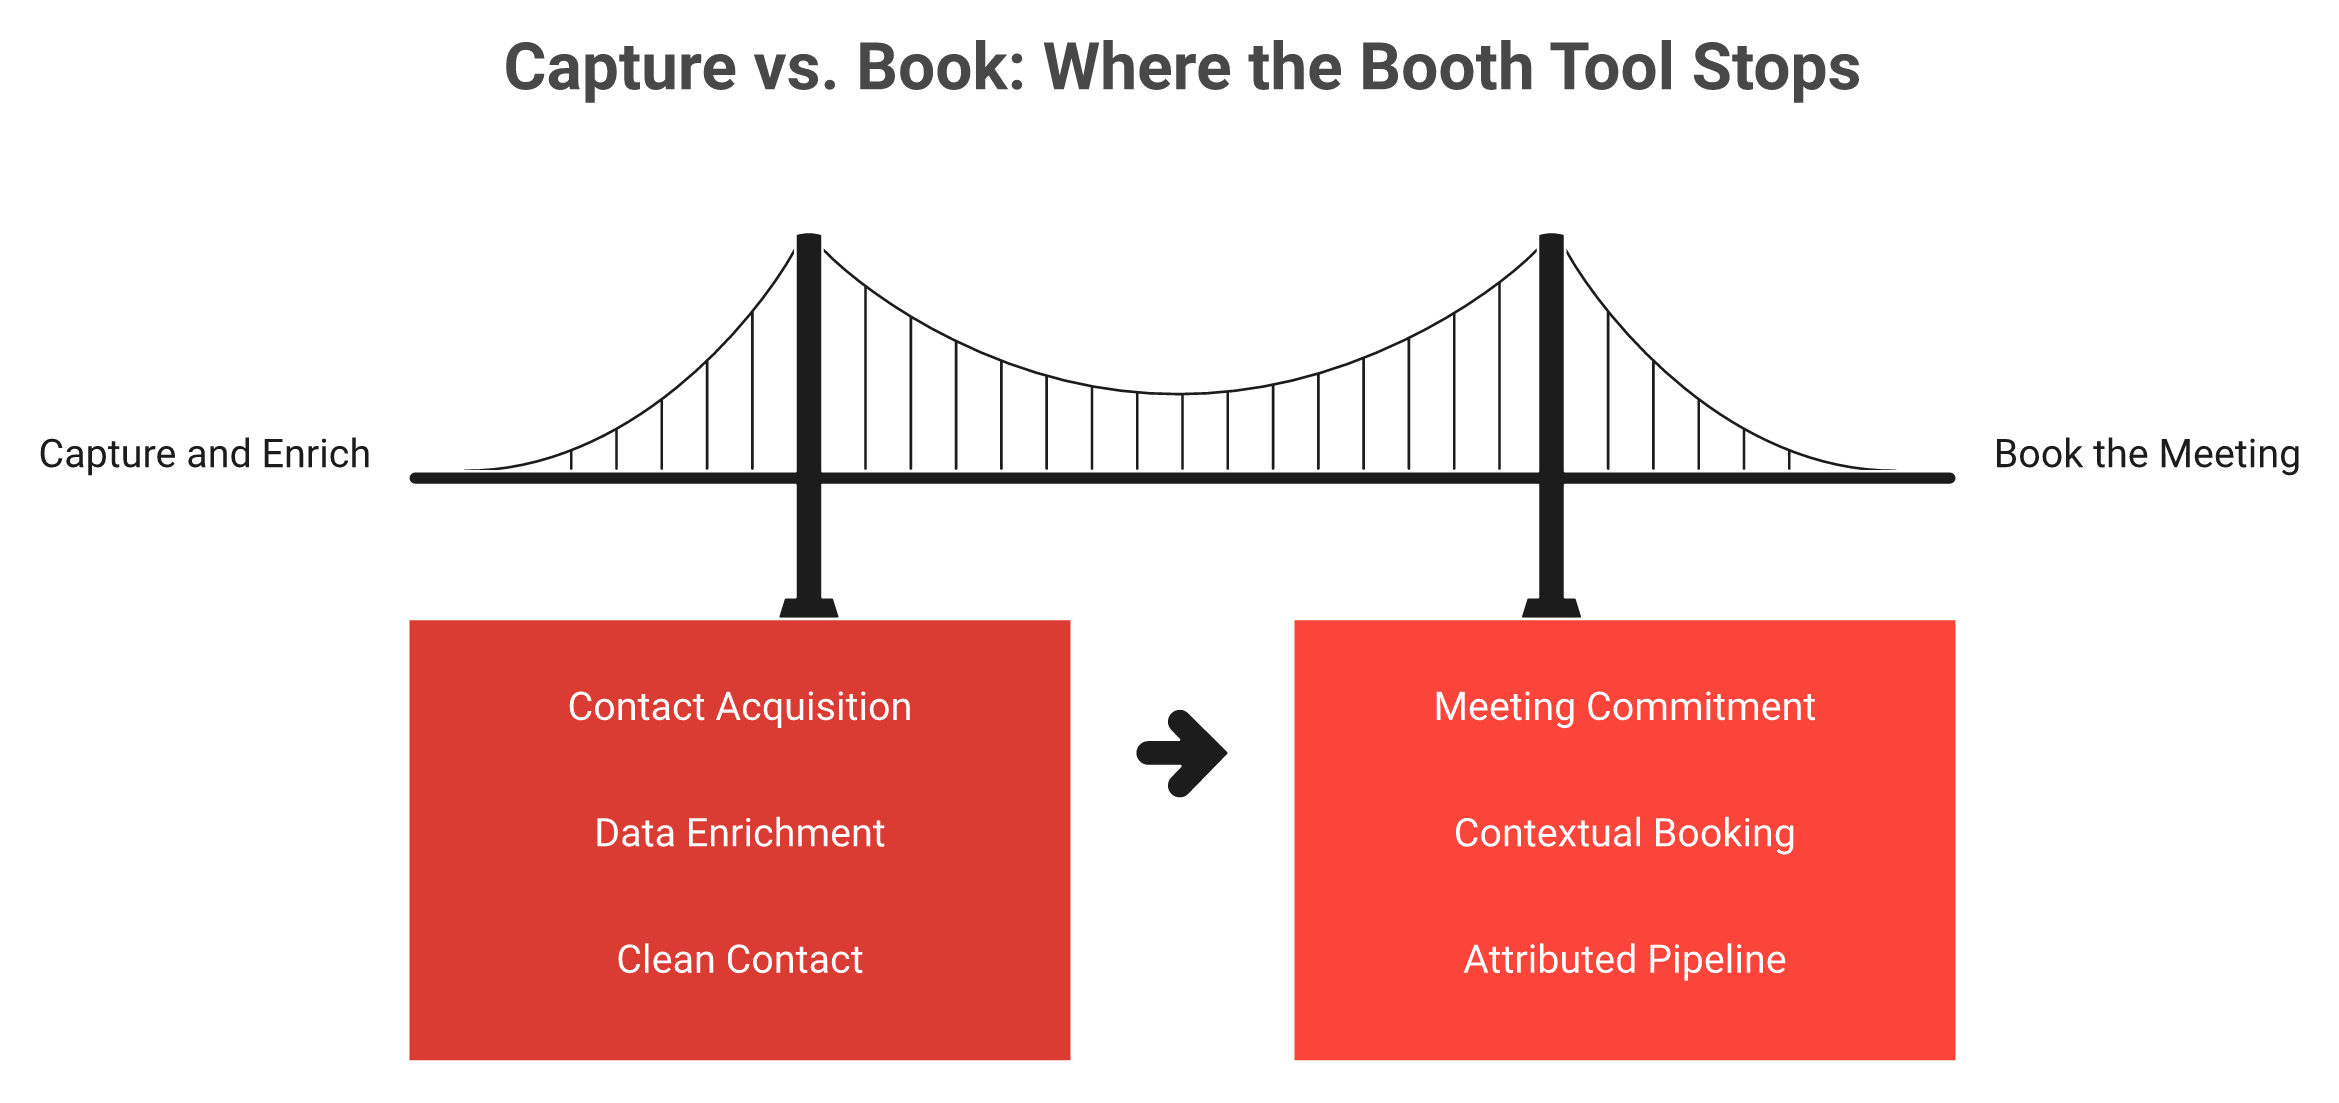
At B2Brain, our whole frame is this offline-to-pipeline lens: capture, then meetings booked, then attributable pipeline. The number worth calculating isn't contacts collected. It's pipeline you can defend, and you can sketch it fast when you Book a Demo.
Mobly captures and enriches the contact; the meeting and the pipeline proof are a separate job.
Mobly captures and enriches the contact; the meeting and the pipeline proof are a separate job.
Q2: Which Costs Belong in the Calculator, Including the 30 to 40% Hidden Spend Most Teams Forget? [toc=2. The Full Cost Stack]
Most teams build the cost side of their ROI math from one number: the booth rental invoice. That is the mistake that gets caught in the budget review.
💸 The full cost stack
Total event cost is far more than rental. A defensible denominator includes space, build and walls, drayage, staff time and travel, lead-retrieval rental (around $600 per device), sponsorships, and follow-up labor. Indirect costs run 30% to 40% of total spend. A bare 100-square-foot booth alone runs $10,000 to $15,000 before a rep flies in. Underloading the denominator inflates ROI and gets caught in the CFO review.
Here is the checklist I'd put in any honest calculator:
Space rental (the floor square footage)
Booth build (one operator's math: "the booth itself was around $3 to $4,000 with no walls, so then walls each wall runs about $600 a piece")
Drayage (moving your crates from dock to booth, a line nobody forecasts)
Lead-retrieval rental (the organizer's scanner, around $600 per device per show)
Staff time and travel (flights, hotels, per diems, salary hours on the floor)
Sponsorships and add-ons (sessions, signage, lanyards)
Follow-up labor (the SDR hours spent chasing the list afterward)
⚠️ Why the hidden 30 to 40% changes the verdict
That same operator landed the all-in number: "anywhere between 10 to $15,000 for us to do this show." For a single small booth. Now add four reps' flights and three nights of hotels.
The spread is real. One seller "spent over $35,000 just on decorating the booth, and that's not even including the booth rental," then at a different show "spent only $950 to set up my booth, a fraction of the cost, and I think it's just as effective."
The point isn't to cut every cost. It's to count every cost. Leave the hidden 30% to 40% out, and your ROI looks great until Finance adds it back.
One quiet line item deserves a flag: that $600 lead-retrieval rental is a recurring sunk cost that buys you a CSV, not pipeline. You pay it every show and the workflow still ends at a spreadsheet. At B2Brain, that's the exact line we think should be working harder, capturing context and booking the meeting, not just dumping contacts, which is the whole point of the workflow built for booth teams.
Q3: How Does the Two-Way Calculator Work, Forecasting ROI and Back-Solving the Lead Count You Need? [toc=3. Using the Calculator]
Every calculator I find online runs in one direction. You feed it results and it grades you afterward. That's a report card, not a plan.
The useful version runs both ways.
⭐ Run the math forward
Forward, you enter cost, qualified leads, meeting rate, close rate, and deal value to get ROI %, sourced pipeline, cost per meeting, and payback.
Here's a worked forward example:
Booth cost: $80,000
Qualified leads captured: 200
Leads-to-Meeting rate: 50%, so 100 meetings
Meeting-to-opportunity: 30%, so 30 opps
Win rate: 20%, so 6 deals
Average deal value: $25,000, so $150,000 closed-won, $750,000 sourced pipeline
That booth returns close to 2x on closed-won and roughly 9x on open pipeline. Now the number is defensible.
🎯 Back-solve the lead count you actually need
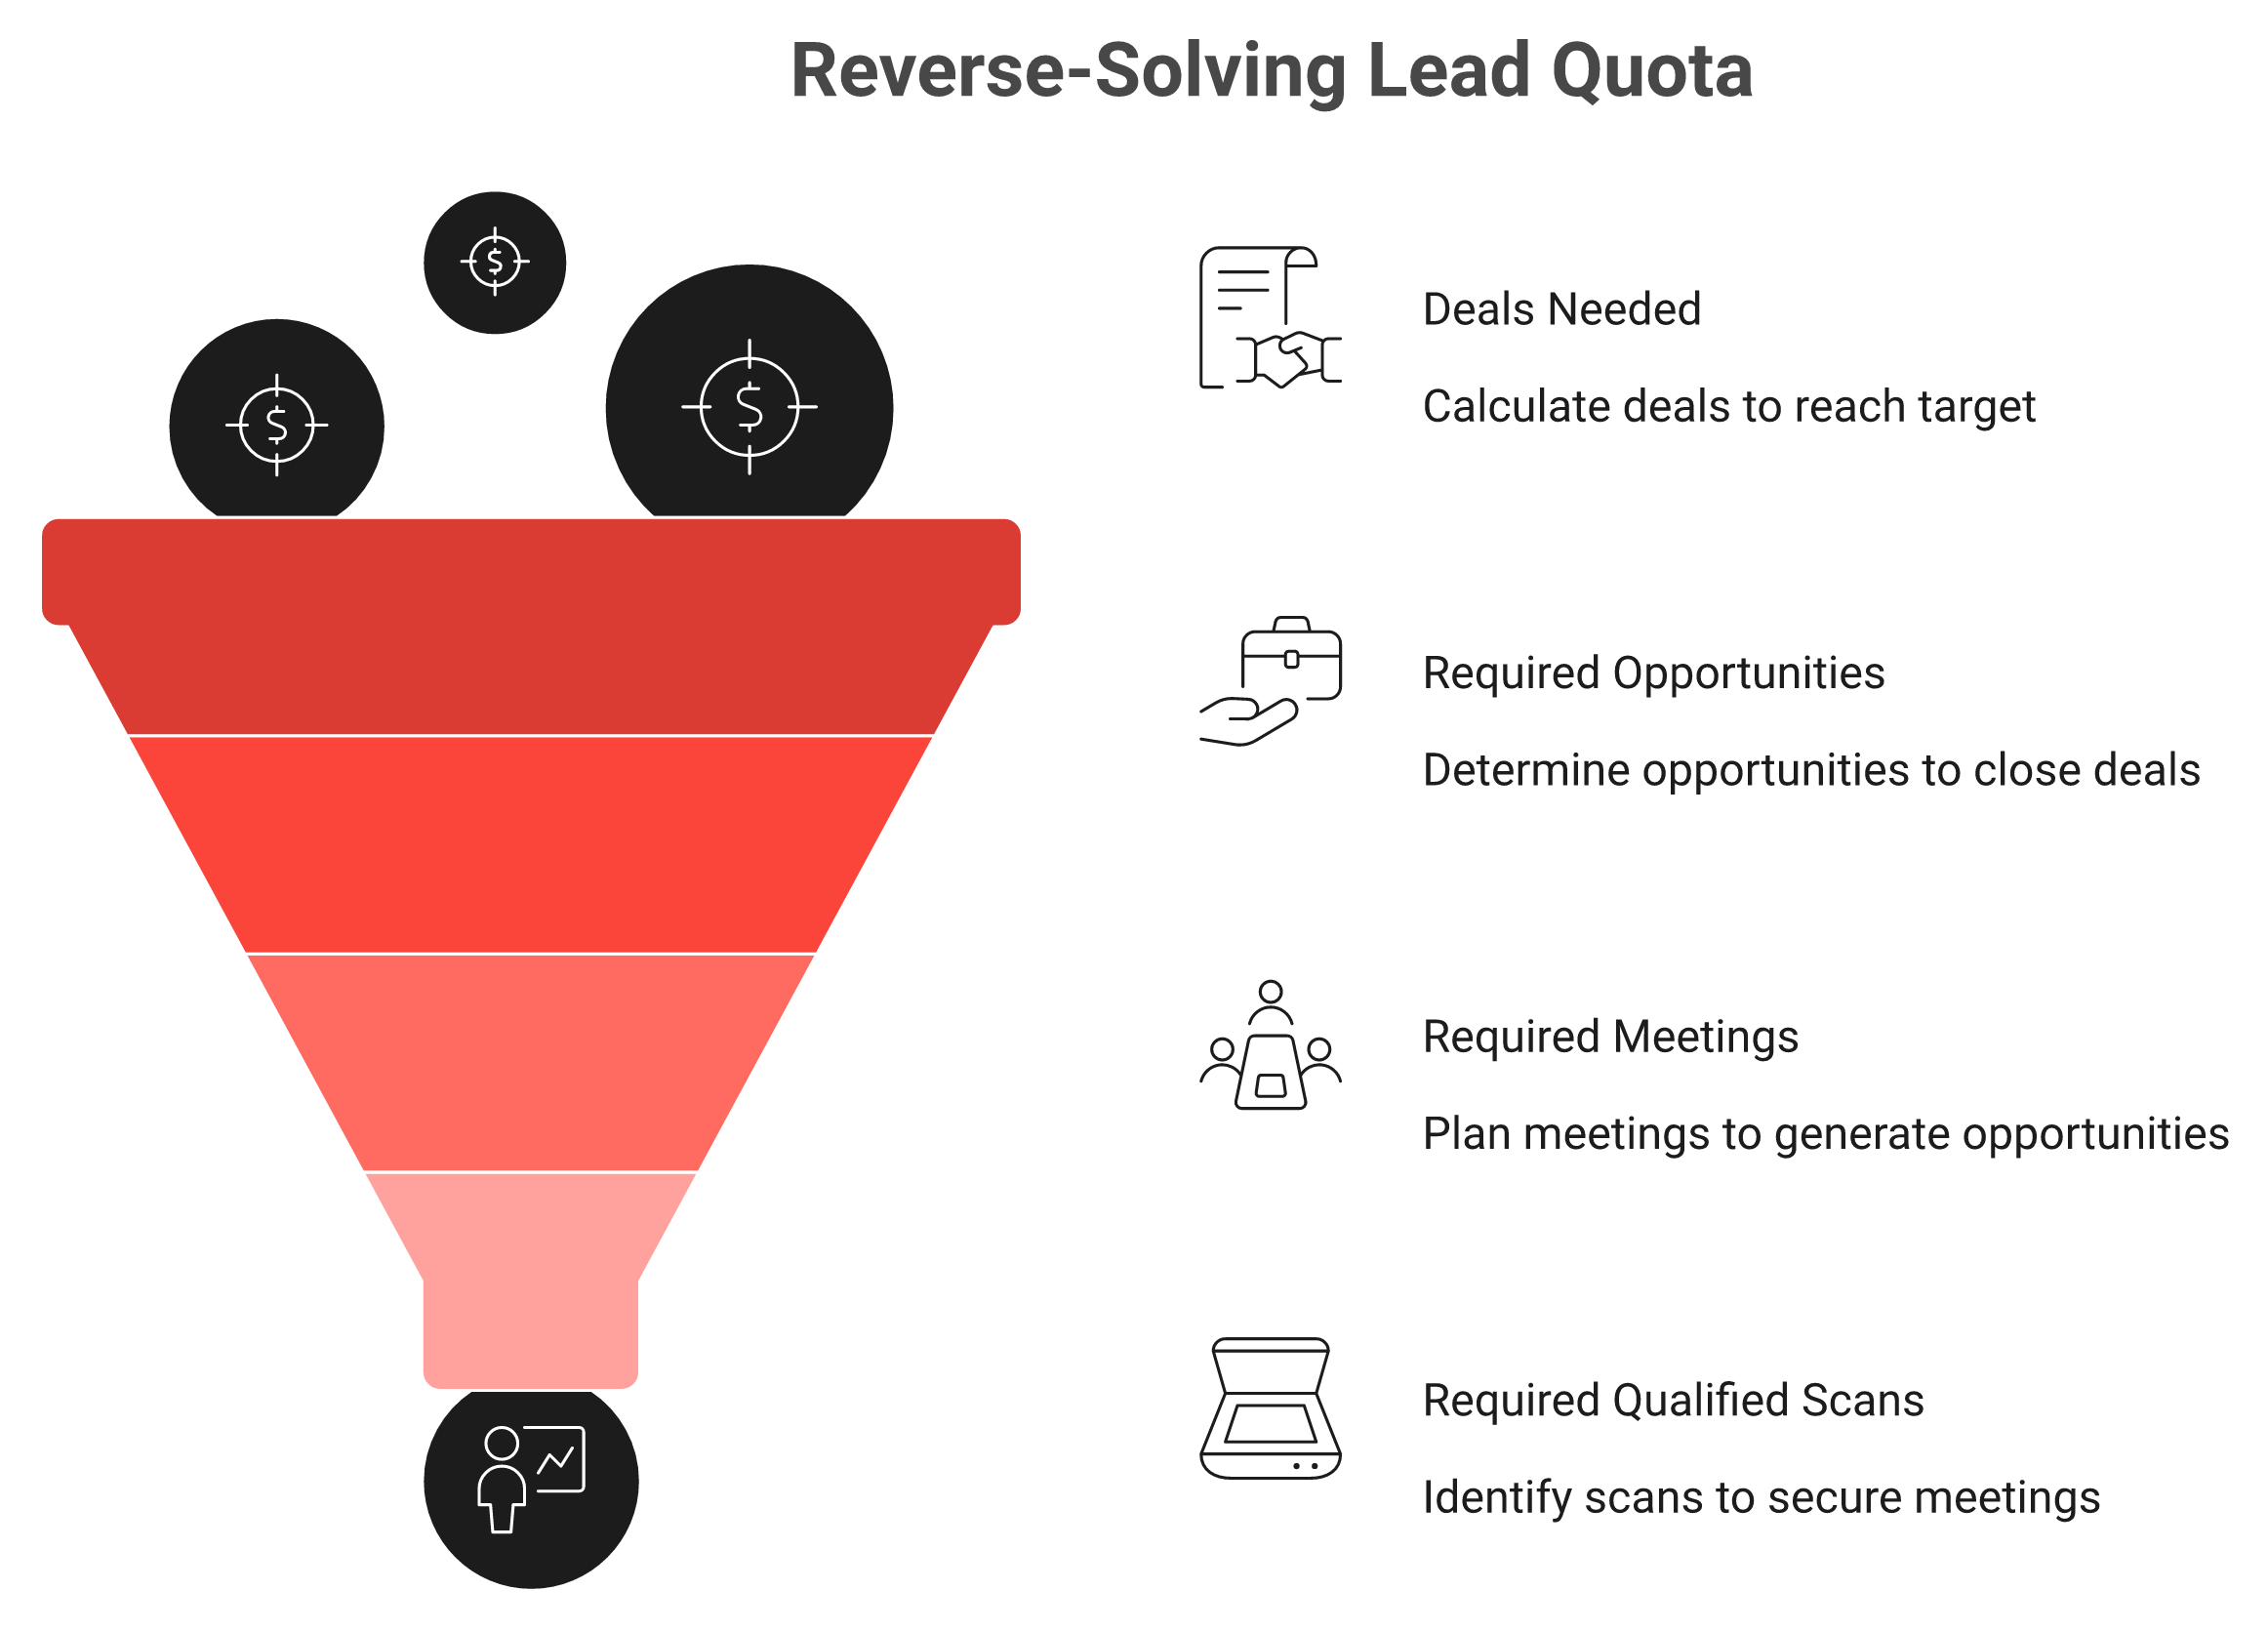
Most teams never do this part. They never compute how many leads justify the spend before the show.
Set a target, then divide down:
Target pipeline: say 3x an $80K booth, so $240,000 sourced
Divide by deal value ($25K): around 10 deals needed, at a 20% win rate, around 48 opportunities
Divide by meeting-to-opp (30%): around 160 meetings needed
Divide by Leads-to-Meeting (50%): around 320 qualified scans
Over a 3-day show, 2 reps: around 53 scans per rep per day
Run the math backward: a revenue target dictates the exact lead quota each rep needs on the floor.
Now compare that to reality. A productive rep captures around 31 quality scans a day. So a 320-scan target with two reps is a stretch, and the calculator just told you that before you wrote the check. This is the kind of math we model across what gets captured on the floor.
This is the buyer's ROI math I walk through with founders constantly. As one operator framed the target itself:
"For every event I want to see three times a return on investment and closed one."
⏰ Why capture quality caps the whole chain
There's a hard ceiling on the top of that funnel. "The brain only has seven seconds to make a decision if it's going to be attracted to something or not." You don't get unlimited qualified conversations on a floor.
So the lever isn't "scan more." It's convert more of what you scan into meetings. That single rate, Leads-to-Meeting, moves the whole model. At B2Brain, that conversion step is exactly what we instrument, and you can see it live when you walk through the booth-day workflow.
Q4: What Is the Leads-to-Meeting (LTM) Metric, and Why Is It the Variable That Moves Your ROI Most? [toc=4. The LTM Pivot]
There's a story every veteran rep recognizes. An operator told it better than I can:
"Jimmy brings the box back with all the leads. Monday morning he pulls out three business cards and calls three people. Then somebody says, 'Hey, want to go to lunch?' He shoves the shoebox under the desk. Six months later they find the shoebox."
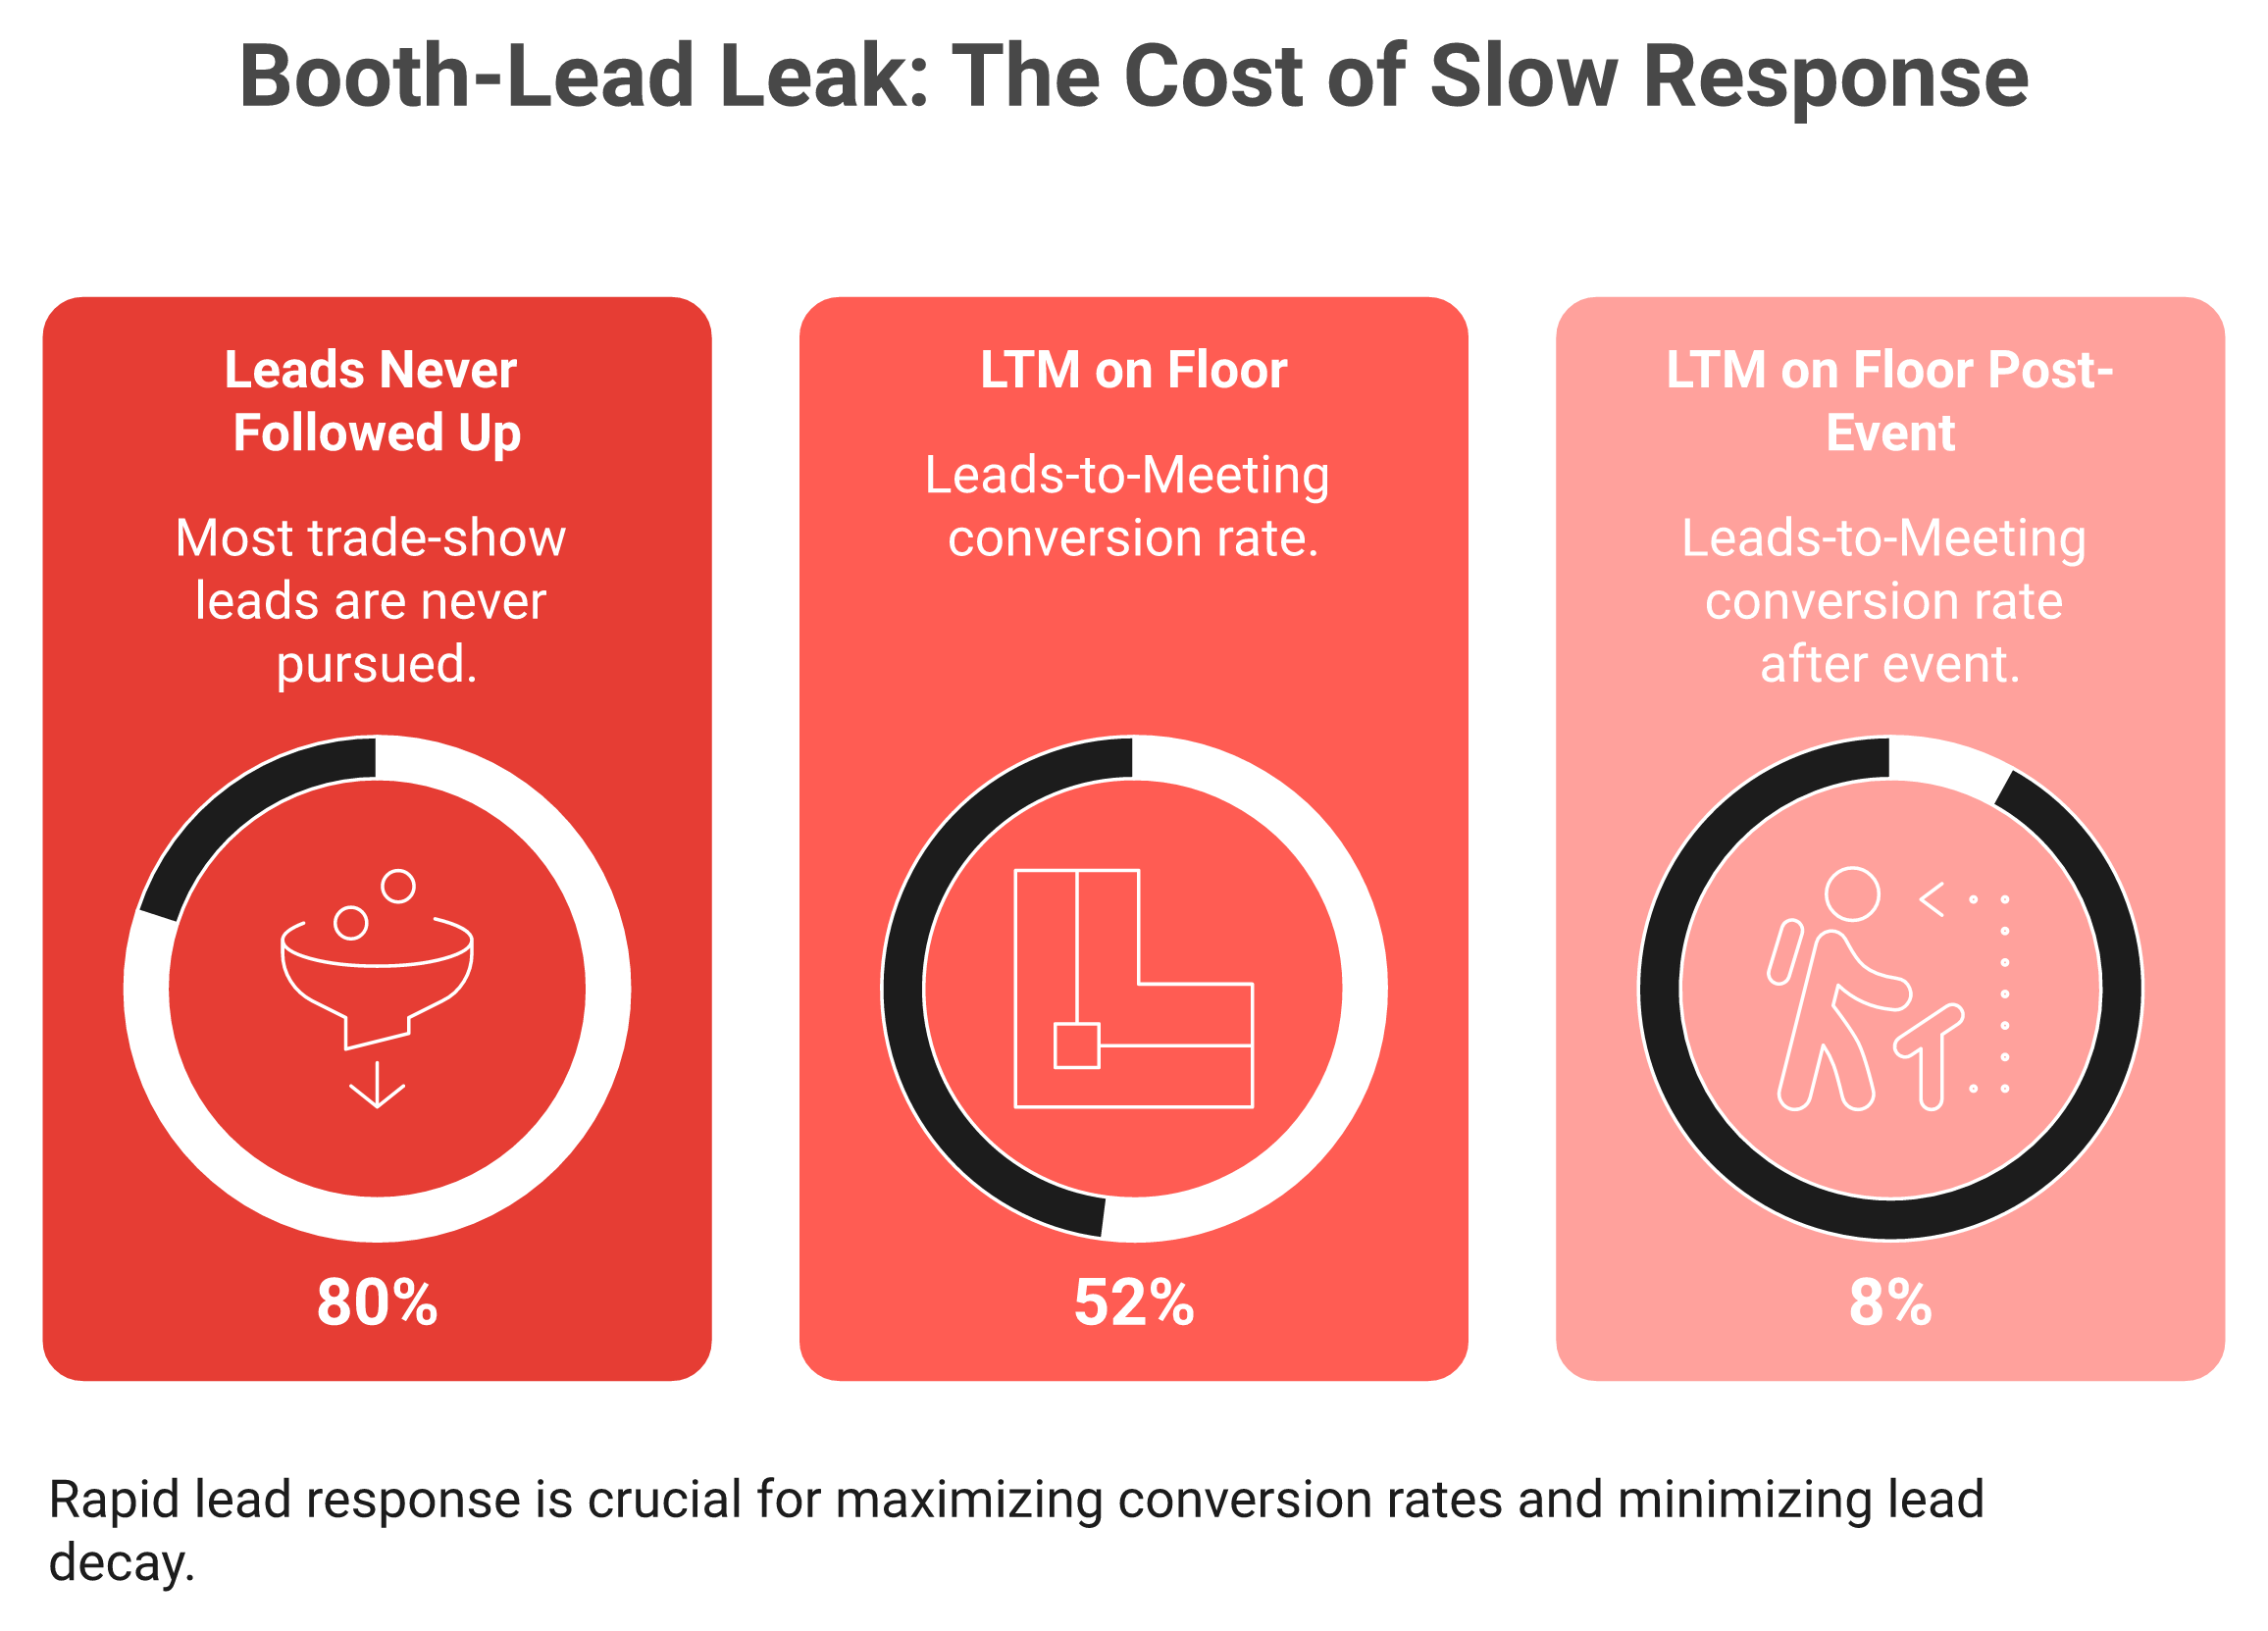
That shoebox is most companies' event follow-up. And it's why raw scan counts mean almost nothing.
📉 Why a 400-scan CSV decays to nothing
Leads don't wait. The lead-decay curve is brutal: conversion probability sits around 85% within two hours of the conversation, then collapses to roughly 9% after one week. By the time Jimmy opens that CSV on Tuesday, the value is mostly gone.
So a booth that "got 400 leads" and a booth that "booked 40 meetings" are not in the same business. One has a contact list. The other has pipeline, the difference that drives real new pipeline from events.
🎯 What LTM measures and why it swings ROI hardest
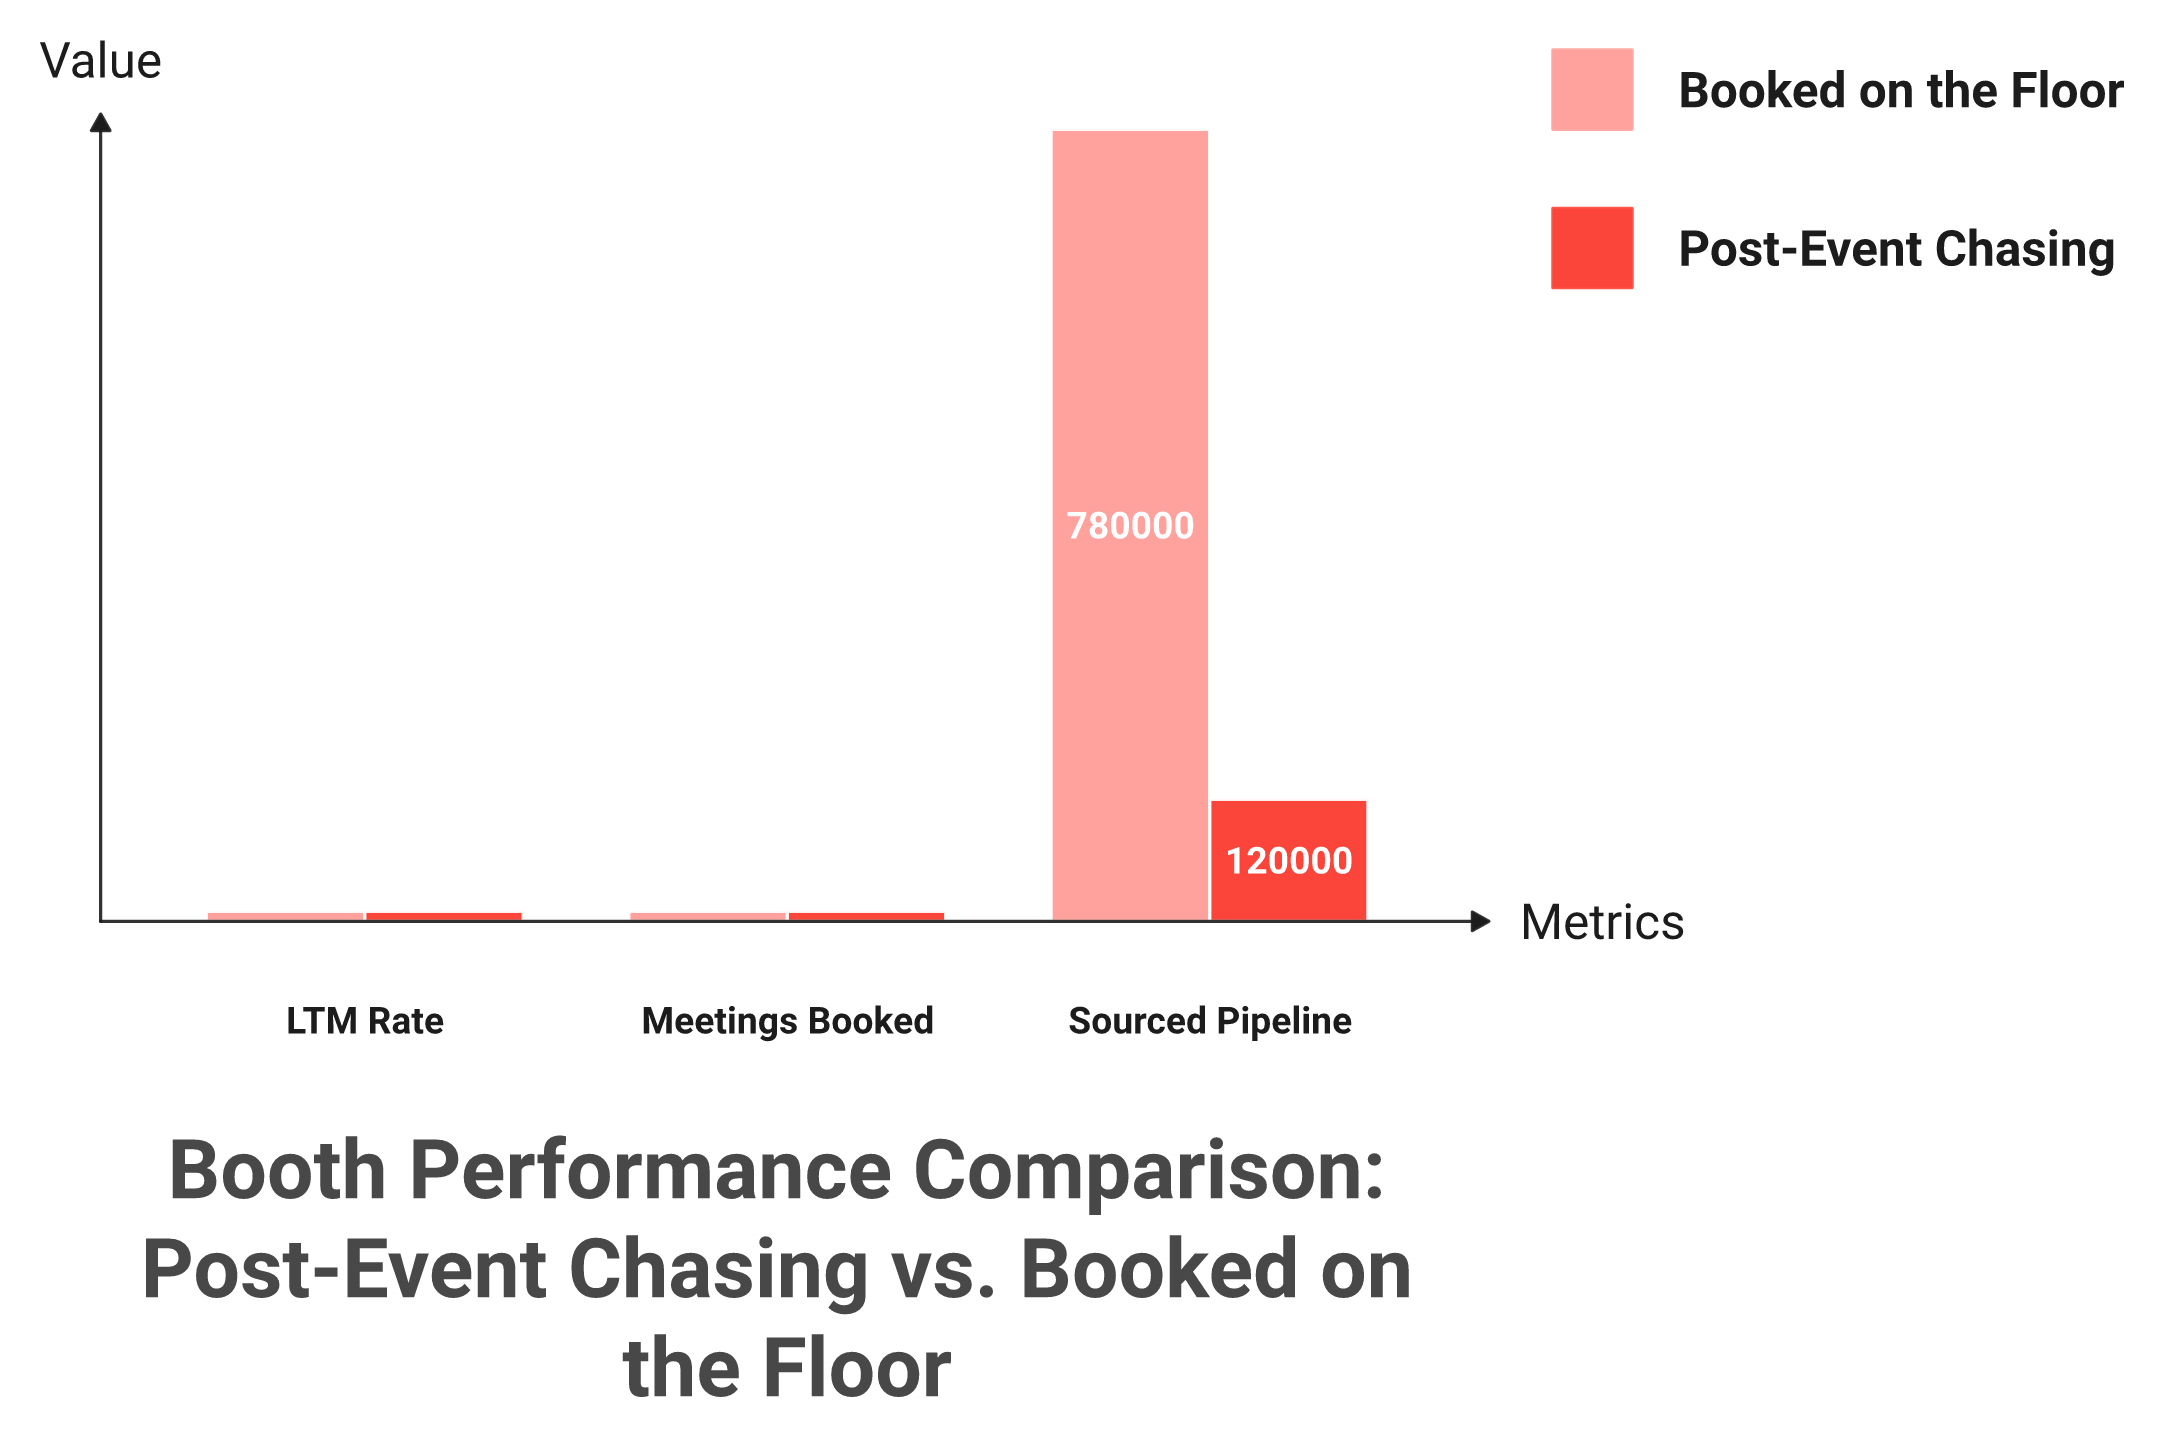
Leads-to-Meeting (LTM) = Meetings Booked divided by Qualified Booth Leads. It's the input that swings event ROI hardest, because raw scans are worthless until they become meetings. Booking on the floor lifts LTM to about 52% versus roughly 8% for post-event SDR chasing, a 6x gap that, against the same booth cost, separates a profitable show from a six-figure write-off.
Watch what that does to Q3's model. Same 200 qualified leads, same $80K booth:
How Leads-to-Meeting Rate Changes the Same Booth's Verdict
Leads-to-Meeting
Meetings
Sourced pipeline
Verdict
8% (post-event SDR)
16
$120,000
Booth looks like a loss
52% (booked on floor)
104
$780,000
Booth pays for itself many times over
Leads-to-Meeting is the lever: booking on the floor turns the same booth and leads into roughly 6x the pipeline.
Nothing else changed. Same floor, same reps, same spend. Only the conversion rate moved, and it flipped the verdict.
⭐ The number no competitor tracks
I might be biased here, so weigh it accordingly. But after watching how reps behave at 4pm on Day 2, when the booth is slammed and nobody can stop to type notes, I'm convinced the meeting has to be booked while the buyer is still standing there.
That's the variable we built B2Brain around. We coined LTM as the metric and made it the thing we report, capturing each conversation by voice in seconds, then booking the meeting on the AE's live calendar before the prospect walks away. To see how booth meeting-booking works in practice, Book a Demo. Most calculators don't even have a field for this; it's the field that matters most.
Q5: How Do You Translate Booked Meetings Into Defensible Pipeline (Not a CSV Nobody Acts On)? [toc=5. Meetings to Pipeline]
I sat beside a Field Marketer one Monday after a big logistics show. The CEO asked one thing: "Where's the pipeline?" She had a tab of 612 scans and no answer. That moment is the whole job.
💰 The pipeline formula Finance will accept
Pipeline = Booked Meetings times Meeting-to-Opportunity Rate times Average Deal Value. The number only counts if it's attributed in the CRM with multi-touch tracking, not estimated from a badge dump. A morning-after, per-show pipeline report with full CRM attribution converts "we got great energy" into a figure Finance accepts, and lets you compare show against show.
The problem with a badge dump is simple. It's a guess dressed as data. Finance discounts guesses on sight.
Multi-touch attribution means crediting every interaction that touched a deal, not just the last click. So the booth conversation gets recorded as a real source, in the CRM, the day it happened. That recording is the backbone of how you generate new pipeline from events.
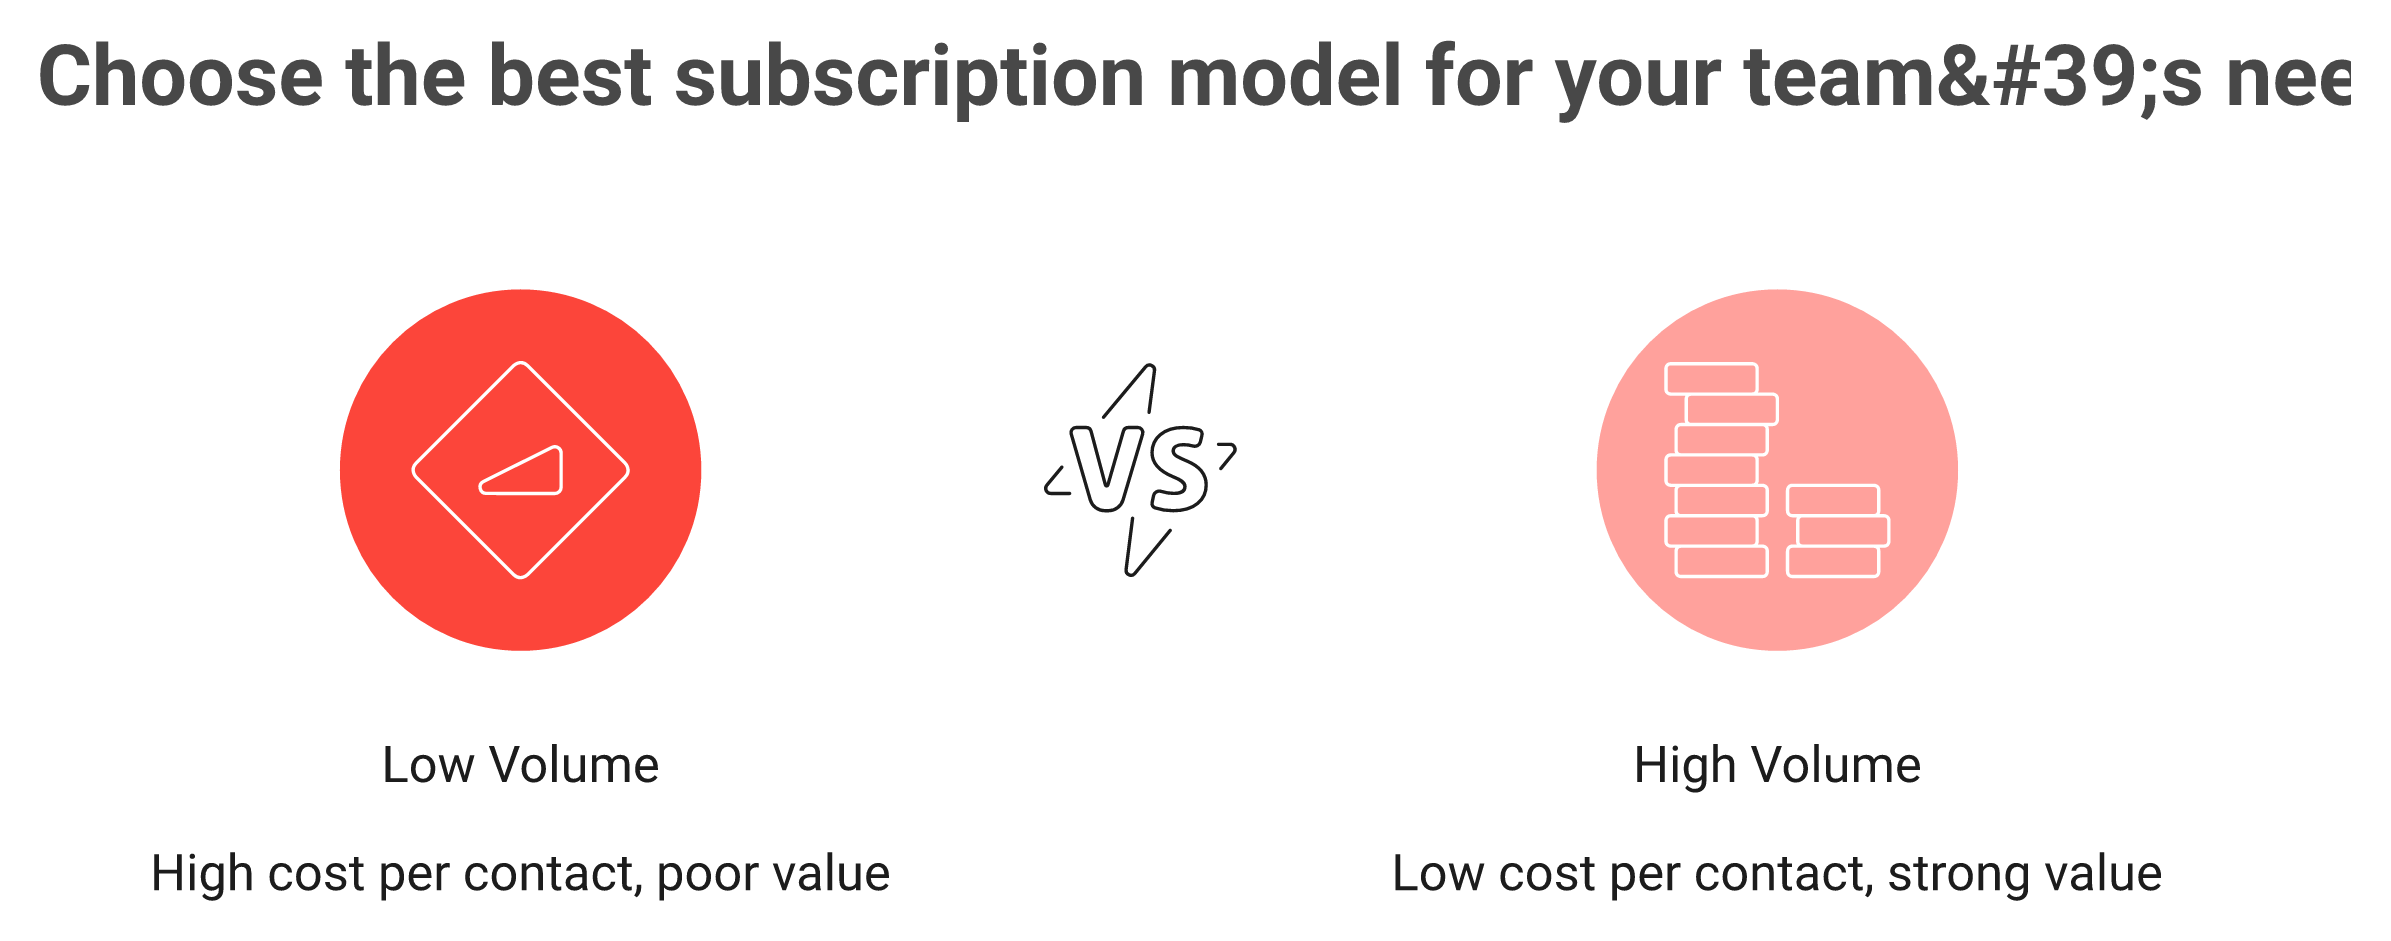
Mobly's flat rate costs the same at 10 or 100 leads, so value depends entirely on volume.
Mobly's flat rate costs the same at 10 or 100 leads, so value depends entirely on volume.
⏰ The tracking cadence that keeps pipeline honest
Pipeline isn't a one-time number. You check it on a schedule. One operator described the rhythm exactly:
"After every single event you're looking at post-event the two-week mark, one month, three month, six month. You are always checking those reports to make sure all leads are being followed up with by sales."
Here's the cadence I'd run:
Post-Show Pipeline Tracking Cadence
Checkpoint
What you're verifying
2 weeks
Every meeting logged, every lead routed to an owner
1 month
Meetings converting to opportunities
3 months
Closed-won landing (the 3x marker)
6 months
Final sourced revenue and true ROI
⭐ Why the report is the real product
I might be biased, but after years of this, the report matters as much as the capture. The capture feeds it. The report wins the budget.
That's why we built B2Brain's offline-to-pipeline report to land by 9am the morning after: pipeline sourced, meetings booked, LTM, and attribution by show, booth area, rep, and segment. A badge scanner saves the lead and stops at the CSV. We write the CRM record and hand the Field Marketer a number, which is the heart of the workflow built for booth teams, because as I tell founders, contact information is not where anything happens. Pipeline is.
Q6: What Is the Payback Threshold, and How Do You Know When to Fire an Event? [toc=6. Payback and Kill Rule]
Most teams never fire a show. They re-book it because they booked it last year. That habit quietly burns budget that a better show would have doubled.
💸 The payback math and the kill rule
Payback period = Total Event Cost divided by Monthly Gross Profit from event-sourced deals, the CAC-payback logic Finance already uses. (CAC means customer acquisition cost.) Pair it with a kill rule: if a show hasn't produced roughly 3x closed-won pipeline by the three-month mark, it's a cut candidate. Because a qualified event meeting can cost about 60% of an outbound meeting, and roughly 40% of paid acquisition, keeping the right shows is defensible. Calculating payback per show is how you reallocate budget.
The 3x rule isn't mine. It comes straight from operators running this math:
"If you spend 10K on a happy hour I want to see 30K in closed-won. Not immediately, because it's a long-term turnaround."
📊 Payback per show, not per portfolio
The mistake is averaging. A portfolio that "did fine" usually hides one show carrying two dead ones.
One manufacturer measured ROI across five annual exhibitions. Two delivered over 300%, one barely broke even. They cut the flat show, moved the money, and lifted overall ROI by 45%. Same budget, better allocation, the kind of call you can make when you tie offline to pipeline per show.
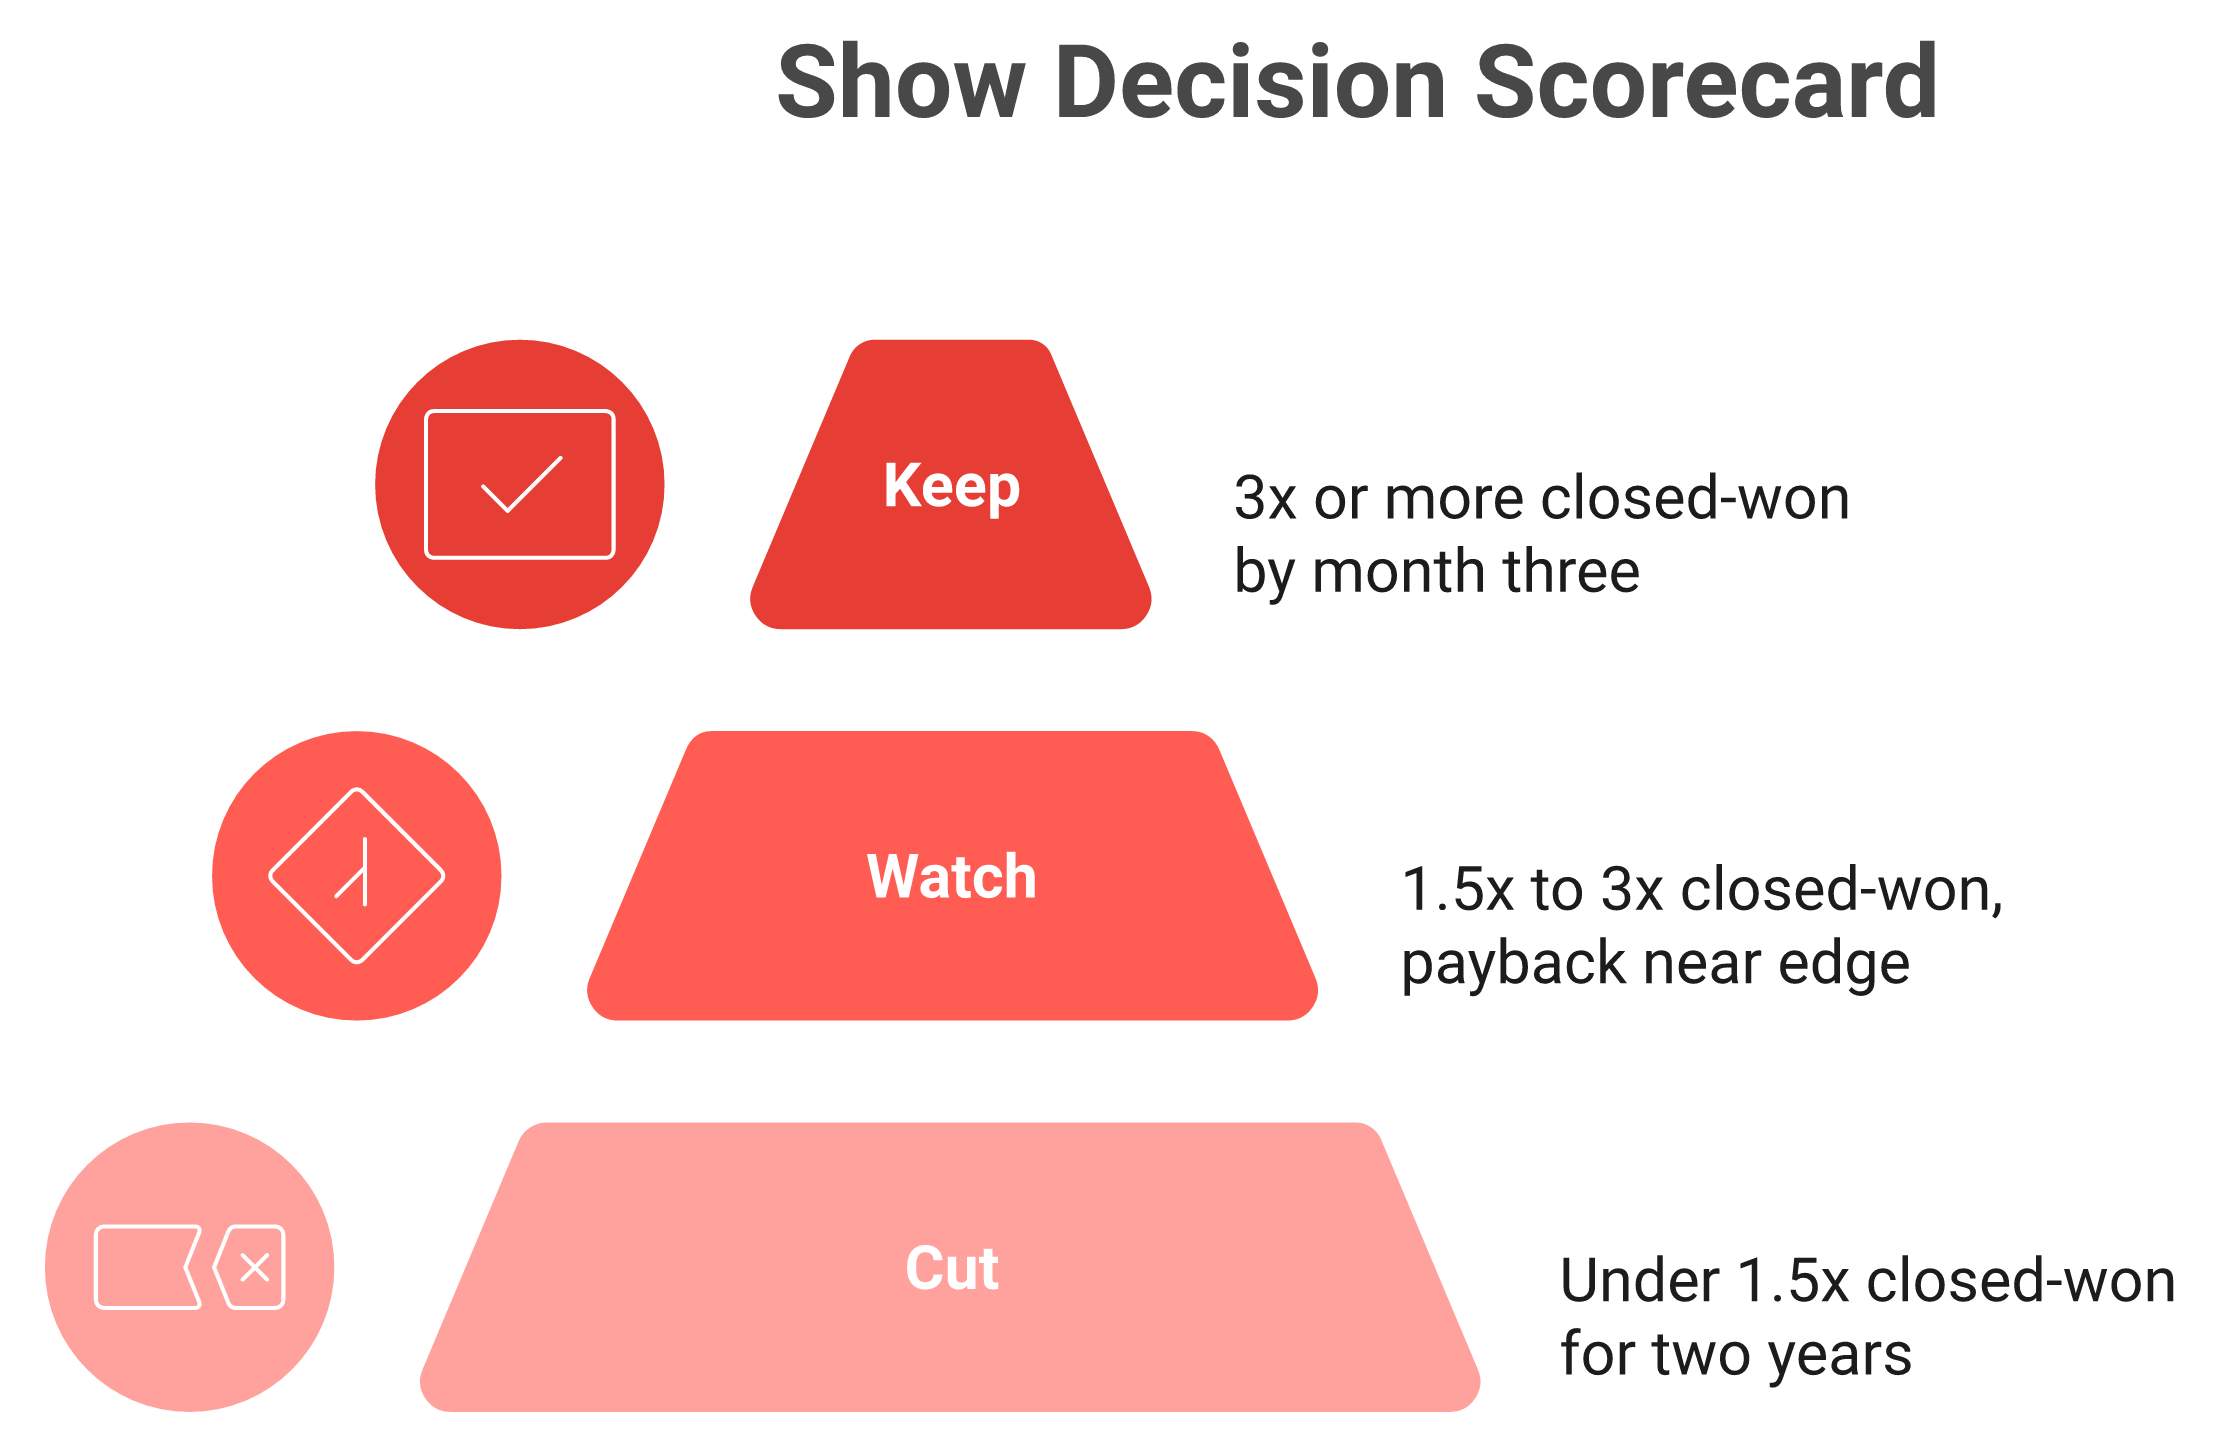
That only works if you score each show on its own. A simple keep/cut scorecard:
Score each show on its own: a 3x-at-three-months rule tells you whether to keep, watch, or cut it.
✅ Keep: 3x or more closed-won by month three, payback under your sales cycle
⚠️ Watch: 1.5x to 3x, payback near the edge, fix capture quality
❌ Cut: under 1.5x two years running, no clear path to fix
⭐ Why cost-per-meeting reframes the call
Here's the part teams miss. The question isn't "was the event expensive?" It's "was the meeting cheaper here than elsewhere?"
We publish that benchmark at B2Brain because it changes the decision: a qualified event meeting runs around 60% of an outbound meeting, and 40% of paid acquisition. When a show clears its payback and beats your paid CAC, you don't fire it. You feed it. To see how the math works against your own shows, Book a Demo.
Q7: How Do the Top Event ROI Calculators Compare, and What Do They Leave Out? [toc=7. Calculator Comparison]
I've clicked through most of the free event ROI calculators that rank today. Most do one thing: take revenue and cost, hand back a percentage, and stop. Useful for a quick gut-check, useless for planning the show.
📊 What each tool actually computes
Here's an honest scoring of the popular calculators on the five things that matter.
Event ROI Calculators Scored on Five Capabilities
Calculator
Forward ROI
Hidden costs
Reverse lead count
Payback output
Pipeline attribution
AMW Group
✅
Partial
❌
Break-even only
❌
Mailmodo
✅
❌
❌
❌
❌
upGrowth
✅
❌
❌
❌
❌
Esrock Partners
✅
Partial
❌
Payback ratio
❌
Luminik
✅
Partial
❌
❌
Sourced pipeline, cost-per-opp
Luminik goes furthest. It surfaces sourced pipeline and cost per opportunity, which most ignore. But even it doesn't reverse-solve for the lead count you need, and none of them treat the booked meeting as the conversion node.
⚠️ What buyers say the gap costs them
Operators feel this gap in the tools they already pay for. The frustration shows up in reviews.
"iCapture solves a major problem for us, the inability to calculate event ROI. It is unacceptable not to have ROI numbers for all marketing campaigns." Mcallaster M. iCapture G2 Verified Review
That's a 4.5-star review, and it's telling: the ROI number is the thing buyers buy a tool to get. Yet capture quality often undercuts it.
"Sometimes Mobly doesn't sync all the leads I've scanned. Without those leads, we end up with a lot fewer than we expected." Verified User in Events Services Mobly G2 Verified Review
If scans vanish, your input is wrong before any calculator runs.
✅ The methodology that closes the loop
The fix isn't a fancier percentage. It's modeling the full chain: lead count, pipeline, and payback, with Leads-to-Meeting as the pivot. That's the approach B2Brain is built around through the three-motion workflow. Pick a tool, or build a sheet, that answers all three questions, not just one.
Q8: What Booth Tactics Quietly Wreck Your ROI Math Before You Even Calculate It? [toc=8. Inputs That Distort ROI]
You can build a perfect calculator and still get a garbage number. The booth feeds the math. If the booth runs on bad tactics, the inputs lie.
❌ The three habits that poison your inputs
Three classics quietly wreck the data. First, the raffle. It pumps your scan count full of people who'll never buy.
"Sign up for our raffle, those things are stupid. The only people that go to get the free iPad is the non-decision-making employee that's just there and signs up for every single thing."
Second, keynote-chasing. Reps wander off to the packed keynote and abandon the floor where deals happen. Third, packing up early. One operator stayed late and won:
"At Adobe Summit, the last 40 minutes every other vendor had packed up. We got some of our best leads and demos in the last 40 minutes because no one else was even there."
Each habit either inflates the lead count with non-buyers or starves it of real ones. Your ROI math breaks either way.
✅ The one question that qualifies on the floor
Clean inputs start with qualification, not collection. The sharpest move is a single context question:
"What made now the right time to talk about this? Now you get all this additional context and you can talk about how your solution solves their immediate problems."
That answer is the difference between a qualified lead and a badge. It's also what makes the lead worth booking a meeting on, and it is exactly what gets captured on the floor. Pair it with speed: a follow-up that hits their phone "within minutes of walking away from me" beats an email blast every time.
Most booth leads decay before anyone calls; speed-to-lead is where pipeline is won or lost.
Most booth leads decay before anyone calls; speed-to-lead is where pipeline is won or lost.
⭐ Why capture quality is the real lever
I'll hedge this, because every floor is different. But from what surfaces when you actually run a booth at 4pm on Day 2, the bottleneck is never scan volume. It's capturing context before it evaporates.
That's the input B2Brain is designed to protect: every conversation captured by voice in seconds, with the "why now" attached, then the meeting booked before they leave. To walk through the booth-day workflow yourself, Book a Demo. Treat the floor like a baited field, everyone there is trying to make a deal, and capture the context that makes the rest of your ROI math true.
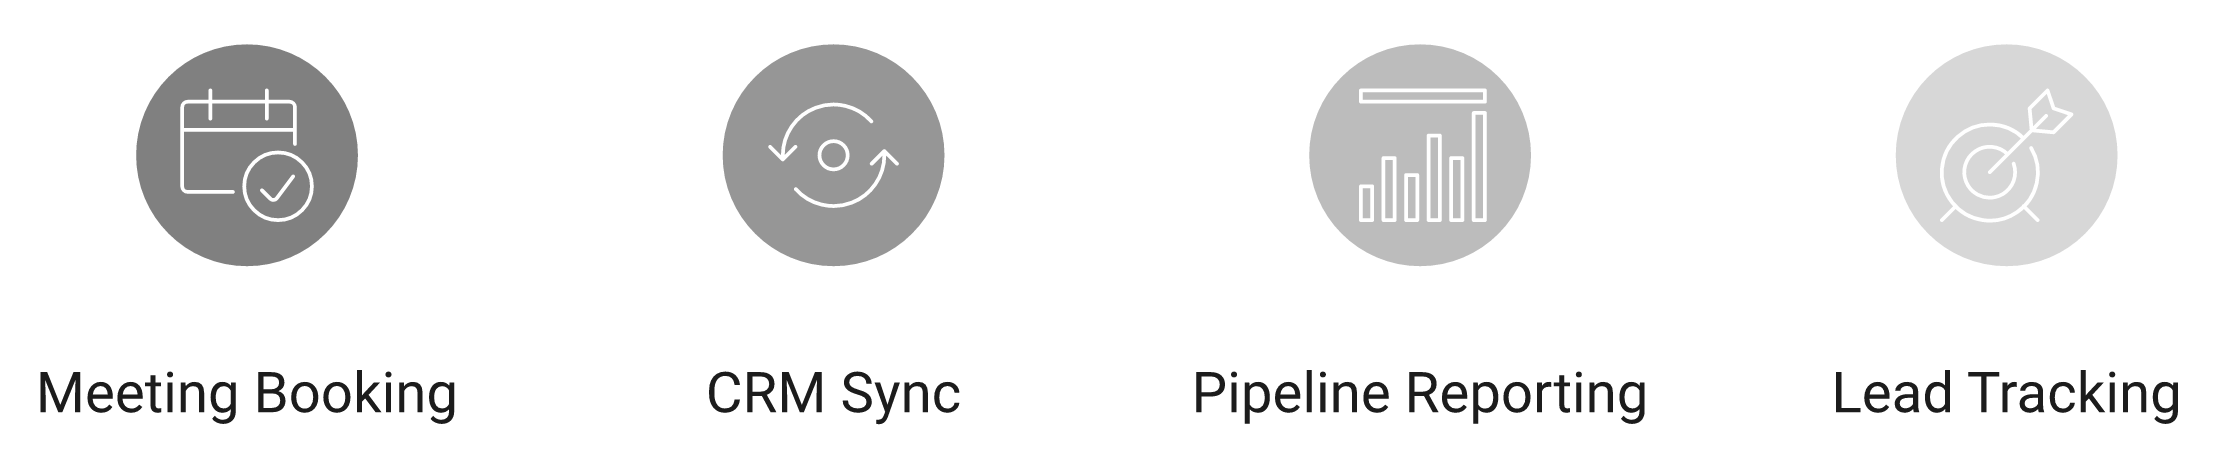
Use this four-point test to judge Mobly or any alternative on pipeline, not scan volume.
Use this four-point test to judge Mobly or any alternative on pipeline, not scan volume.
FAQ's
What is an event ROI calculator and what does it actually compute?
An event ROI calculator turns booth spend into a defensible return. We compute it as ROI percent equals pipeline-sourced revenue minus total event cost, divided by total event cost, times 100.
The catch is that the simple version misleads B2B exhibitors. Your closed-won revenue often lands three to six months after the show, so the number reads zero in the quarter you exhibited and the event looks like a failure when it is not.
The honest model tracks the whole chain instead of a single percentage:
Qualified leads captured
Meetings booked
Sourced pipeline
Closed-won revenue and payback
A good benchmark is 200 to 400 percent, or roughly 3x closed-won pipeline. We pair every number with a comparison, because a percentage alone tells a CFO nothing. The four inputs that matter are qualified leads, booked meetings, win rate, and average deal value, which is the basis of how we generate new pipeline from events. Contact count is not an input worth tracking; defensible pipeline is.
Which costs should go into the event ROI calculator?
Most teams build the cost side from one line: the booth rental. That single mistake inflates ROI and gets caught in the budget review.
A defensible denominator counts every cost, not just the obvious one:
Space rental and booth build, including walls at around 600 dollars each
Drayage, the freight line nobody forecasts
Staff time and travel, including flights, hotels, and salary hours
Lead-retrieval rental, roughly 600 dollars per device per show
Sponsorships, signage, and follow-up labor
Indirect costs run 30 to 40 percent of total spend, and a bare 100-square-foot booth alone runs 10,000 to 15,000 dollars before a rep flies in. Leave the hidden costs out, and your return looks great until Finance adds them back.
We flag one quiet line in particular. That recurring lead-retrieval rental buys a spreadsheet, not pipeline, which is why we built the booth-day workflow to capture context and book the meeting rather than stopping at a CSV. The goal is to count every cost, not cut every cost, so the denominator survives scrutiny.
How many leads do we need to hit our trade show ROI target?
This is the calculation most teams skip. They grade the show afterward instead of planning the lead count before they write the check.
We run the math backward from the target. Say an 80,000 dollar booth needs 3x closed-won, or 240,000 dollars sourced:
Divide by deal value to get the deals needed
Divide by win rate to get required opportunities
Divide by meeting-to-opportunity rate to get required meetings
Divide by your Leads-to-Meeting rate to get required qualified scans
That chain often lands near 320 qualified scans, or roughly 53 per rep per day across a three-day show with two reps. A productive rep captures around 31 quality scans a day, so the calculator just told you the target is a stretch before the show, not after.
The lever is rarely 'scan more,' since the brain takes seven seconds to decide if a booth is worth approaching. The lever is converting more of what you scan, which is exactly what the three-motion workflow instruments. We pair the forecast with the reverse math so the quota is real.
Why does the Leads-to-Meeting (LTM) metric matter most in the ROI calculation?
Leads-to-Meeting, or LTM, equals meetings booked divided by qualified booth leads. We coined it because it is the single input that swings event ROI hardest, and no other calculator models it.
Raw scans are worthless until they become meetings. The lead-decay curve is brutal: conversion sits around 85 percent within two hours of the conversation, then collapses to roughly 9 percent after a week. The shoebox of business cards that surfaces six months later converts at almost nothing.
Here is the swing on the same 80,000 dollar booth and the same 200 qualified leads:
At 8 percent LTM, post-event chasing, you book 16 meetings and source about 120,000 dollars
At 52 percent LTM, booked on the floor, you book 104 meetings and source about 780,000 dollars
Nothing changed except the conversion rate, and it flipped the verdict. Booking the meeting on the AE's live calendar before the prospect walks away is the mechanism behind that 52 percent floor. You can see what gets captured on the floor and why the meeting, not the contact, is the real unit of return.
How do we know when a trade show is worth re-booking versus cutting?
Most teams never fire a show. They re-book it because they booked it last year, and that habit quietly burns budget a better show would have doubled.
We make payback an explicit output. Payback period equals total event cost divided by monthly gross profit from event-sourced deals, the same CAC-payback logic Finance already trusts. Pair it with a kill rule:
Keep: 3x or more closed-won by month three, payback inside your sales cycle
Watch: 1.5x to 3x, fix capture quality first
Cut: under 1.5x two years running with no path to fix
Score each show on its own, never on a portfolio average, since one strong show usually hides two dead ones. A qualified event meeting can cost around 60 percent of an outbound meeting and 40 percent of paid acquisition, so when a show clears payback and beats your paid CAC, you feed it rather than fire it. To pressure-test your own shows against this math, you can Book a Demo and walk through a per-show pipeline report.
Enjoyed the read? Join our team for a quick 30-minute chat — no pitch, just a real conversation on how we’re rethinking Event Intelligence in B2b.

.png)
.png)
.png)